Rental housing: a potential growth spot in the Russian market

Written by Andrey Vakulenko – MACON Realty Group, EECFA Russia

The residential rental market in Russia is now at the initial stage of development: professional* projects are just beginning to appear, and almost the whole supply is made up of private units in the unorganized* market. However, the active participation of the state and the expected set of measures to stimulate developers and support demand for rental housing should contribute to the active development of the segment: by 2030 at least 45 million sqm of rental houses are planned to be built. At the same time, the longer-term potential is estimated by market experts at the level of at least 20% of the total housing stock in Russia, with the current value of 6% (in absolute terms, about 520 million sqm). Even with the partial realization of the indicated potential, rental housing will certainly play a major part in the Russian construction market in the coming years.

*In this article, by ‘organized/formal/professional, we mean rental objects under professional management such as apart-hotels, rental houses with professional operators, co-living and so on, while by ‘unorganized/informal’ segment we mean individuals renting out their own apartments.

source: DOM.RF

Current rental market

Total rental supply in Russia is estimated at 240 billion sqm (DOM.RF) with about 97% rented by private individuals and most of them not being officially registered with no taxes paid. Yet, professional rental properties (apart-hotels, apartment buildings, co-living, etc.) throughout Russia total at about 60 units, with 45 located in Moscow and St. Petersburg. The segment, despite the current relatively low supply, is developing quite actively, though: over the past 3 years, the market increased 1.6 times in project number, and will likely continue to grow rapidly in mid-term since 31 new projects are under construction with 18.2 thousand dwellings (now the volume of supply in the market is about 10.4 thousand dwellings and about 3.3 thousand beds in co-living).

Plans for regulation

The active development of professional rental homes, the need to regulate the shadow rental market, as well as the current state policy to improve living conditions in Russia in general, have led to new legislative initiatives with three main goals: 1) creating conditions for the further development of the formal market; 2) tightening the regulation of the informal segment; 3) creating a large block of social rental housing on preferential terms for citizens with below-average wages who cannot afford to take out mortgage.

In August 2021, the Ministry of Construction proposed a number of amendments to the current state program dubbed ‘Provision of affordable and comfortable housing and utilities for citizens of the Russian Federation’. Although the planned changes have not yet been adopted and are being examined by anti-corruption experts, it is highly probable that they will come into force. The main measures of the state program for the rental segment are: 1) tax incentives, including building or creating buying out apartments (a separate section) in a building under construction and making it a rental object rental homes through collective investment mechanism, 2) tax deduction in the amount equal to rent payments, 3) building or creating rental homes through PPP schemes, 4) subsidizing rent and 5) the provision of land plots on preferential terms.

These measures will ensure the annual volume of rental housing construction of about 5 million sqm by 2030. The stages of implementation are as follows:

  • By end 2021: tax incentives, preferential terms for the provision of land and connection to engineering networks will be developed,
  • By 2024: a fully transparent and legal rental market must be created,
  • By 2030: 45 million sqm of rental housing built (between 2022 and 2030).

Social rental housing

The planned changes are to create the social rental housing segment mainly through the state-owned company DOM.RF, which is currently one of the main financial institutions for the development of the housing sector in Russia. They intend to provide preferential rent for people in need of better housing conditions and for citizens with below-average incomes who cannot afford to take out a mortgage loan to purchase own housing. It will subsidize up to 80% of the rental rate for these categories of citizens. In 2021–2024 about RUB 650 billion will be allocated for this purpose. It is planned to attract private investors and developers to implement social housing projects to build such facilities on preferential terms and are guaranteed to receive the required demand. The difference between the reduced preferential rate and the market rental value will be covered by the state budget, so developers’ lost profit will be compensated for. This should stimulate the construction of new rental homes and increase the attractiveness of the segment for developers previously not interested in such projects due to the long payback periods and the high level of market risks.

Whitening the segment

Another important area of ​​the regulation to contribute to the development of formal rental housing in professional projects is the measures to increase the transparency of the informal market. According to expert estimates, over 90% of housing in Russia is rented out by landlords not paying taxes. Even though the situation slightly improved after the law on the self-employed came into force which lowered the tax rate for renting out housing from 13% to 4% (under several conditions), but most of the market remains in the shadows. Authorities intend to resolve this issue through the introduction of measures in 2021-2024. As of September 2021, the real steps are still under discussion and specific decisions have not yet been made, but, in general, the following steps are planned:

  • a unified electronic system for all residential lease transactions with data from the register being transferred directly to the tax office,
  • a standard lease agreement to protect the rights of tenants,
  • a unified online register of owners renting out housing,
  • to regulate relations between tenants and landlords, a special state-owned company will be created as an intermediary between the parties,
  • penalties for failure to provide data on renting out residential property, and
  • a publicly available ‘blacklist’ of homeowners evading tax liability.

Although this will likely increase the security of rental transactions for tenants, the main difficulty of the transition to the new system will be that it is voluntary for homeowners to register, transfer their data and start paying taxes. Thus, it is planned to provide tax incentives for landlords complying with the new rules in good faith, and to develop additional support measures such as the possibility of introducing a system of guarantees on the part of an intermediary company against non-payments for landlords, as well as insurance against early termination of the contract unilaterally by the tenant, among others. It is also assumed that penalties will gradually be introduced with a long transition period.

Despite all the advantages, the regulation of the informal rental market will lead to increased rental charges: additional taxes and other costs that landlords will have when switching to the new system will be passed on to tenants. This will raise the competition of the informal market with formal rental properties that on average are significantly more expensive than renting homes from individuals, limiting demand for them.

Residential forecast for Russia is available in the latest EECFA Forecast Report Russia up to 2023. For orders and sample report, please visit eecfa.com. EECFA (Eastern European Construction Forecasting Association) conducts research on the construction markets of 8 Eastern-European countries, including Russia.

Fundamental factors determining the segment:

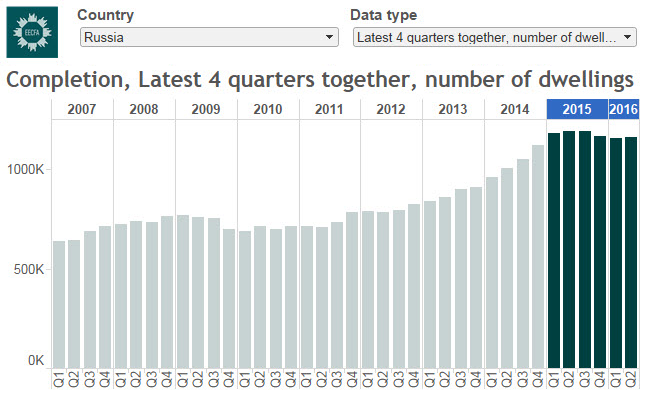
  • Insufficient level of living space and low availability of housing. At the moment, the former indicator is at the level of about 26 sqm/person, less than the values ​​in most European countries and less than the level of comfortable living conditions (30 sqm/person). The construction of at least 600 million sqm would be required, which, with the current volume of completion, would take at least 8 to 10 years. The level of affordability of own housing for the wide range of the population is low. According to the estimates of DOM.RF and the Ministry of Construction, mortgage loans – the key means to buy housing in Russia – are currently unaffordable for 35% of the population who needs to improve living conditions. Such families will not be able to take out a mortgage even with a zero loan rate as their income will be insufficient for monthly repayments. Housing rental is a potential solution, so social rental projects are of key importance.
  • Low level of development of the rental housing market. As of end 2020, only about 6% of the Russian population (about 8.8 million people or about 5.5 million families) lived in rental housing, while this figure in developed countries can reach 50%-60%. Even in the largest Russian cities with the most developed rental markets, the share of rental housing in the total stock does not exceed 10%, which can also be assessed very low.
  • High potential for development. DOM.RF (by far the biggest rental housing operator in Russia) estimates a realistic achievable share of rental housing in the total stock at about 20% long-term. With the current volume of the housing stock (about 3.9 billion sqm), this is potentially about 750 million sqm of rental housing, (about 240 million sqm already built and about 520 million sqm still to be built). The current version of the state program plans to build about 45 million sqm of rental housing until 2030. The market potential will surely not be exhausted in the coming years, making the overall prospects favorable for the segment in the long run.
  • Pandemic effects. The pandemic has had two main consequences. First, a sharp deterioration in the macroeconomic climate last year and a long-expected economic recovery after the recent shocks. Against the backdrop of falling real incomes, own housing has become even more inaccessible for many people, and for some, renting can become a permanent replacement. Second, although less significant to the rental market, the growing popularity of remote work and new sources of demand for rental housing. With many companies shifting to a fully or partially decentralized work format, employees have more opportunity to choose where to work. This raises the number of digital nomads, i.e. employees not tied to an office and having the opportunity to work from any Russian city. The number of transactions in the rental market in mid-term will to some extent grow due to this category. One of the trends in the rental housing is the workspitality format focusing on the needs of such nomads (separate work areas, co-working spaces, meeting rooms).
  • The absence of major growth in real incomes and the lack of macroeconomic prerequisites for this on the horizon. Real disposable income was in the negative between 2014 and 2017 (the decline varying from 0.5% to 4.5% per year), followed by a short period of positive correction (+0.1% in 2018 and +1% in 2019), and then by another decline at end 2020 (-3.5%). Thus, purchasing power has actually been declining for 7 years. At the same time, the Ministry of Economic Development forecasts a rather moderate dynamics of this indicator in 2021-2023: +1.6%-1.9% per year in a conservative scenario and +2.4%-3% per year in the baseline scenario. But even in the best case, by 2023 purchasing power will not return to the level of 2013, which should not contribute to more home purchases, but should grow demand for the rental market.
Continue reading Rental housing: a potential growth spot in the Russian market

EECFA countries in the European Commission’s 2021 Macro Forecast

EECFA has again examined the main changes in the prospects between the Autumn 2020 and Spring 2021 Macro Forecasts of the European Commission for those EECFA member countries which are covered by this forecast; Bulgaria, Croatia, Romania, Russia, Serbia, Slovenia, Turkey, plus Hungary.

Written by Bálint Parragi, EECFA Research, ELTINGA

After a severe recession during last year, the global economy as a whole could grow again in Spring 2021, and it is expected to continue doing so. As the first chart shows, GDP in all countries could recover fast and return to an increasing trajectory.

In Autumn 2020, projections showed the majority of the countries in the EECFA region with a stagnating or very slowly increasing economy. This was mainly due to the composition of the 3-year-average comprising a year with a very deep recession, and the two upcoming years with cautious estimations of growth. The only two economies with growth exceeding 1% were Serbia and Turkey (2.3% and 2% respectively) as these economies shrank least in 2020 (-1.8% and -2.5%).

On the other hand, the results are quite different in the European Commission’s Spring 2021 report where every EECFA country registers a positive GDP growth with all of them being at least 0.5%. The order of countries is almost identical to the one in Autumn 2020 and we can see a grouping of countries:

  • The first one is the group of the highest growing two countries, Serbia and Turkey again. This time, Turkey has a higher average growth, though (+3.7% and +2.8% respectively). The significant growth is the result of the slight contraction (or even growth) during 2020 (-1% in Serbia and +1.8% in Turkey).
  • The second group consists of countries with a negligible growth according to the Autumn 2020 report (+0.4-+0.7%) but with a more remarkable increase projected in Spring 2021; above 1% in each case and reaching 1.5% in Romania, Hungary, and Slovenia.
  • The economies in the last category: Croatia, Russia, together with the EU, all decreased according to the Autumn 2020 report, but in the Spring 2021 report it seems that they have better prospects in the future as they may grow to a little extent (+0.5-+1.1%).

When it comes to total investment (gross fixed capital formation) data, two general conclusions can be drawn:

  • Firstly, the projection in Spring 2021 is higher for every country than the Autumn 2020 values. The upward revision is especially remarkable for Turkey, Croatia, and Romania. This again could mean that economic recovery is expected to be a rapid process.
  • Secondly, the expected GFCF growth is positive in every country in 2021, except for Russia where it is close to zero. However, the countries are not homogeneous as Romania, Serbia, Turkey, Croatia and Slovenia have an expected growth within 4%-6%, but Hungary, Bulgaria, and Russia, as well as the EU, has a growth smaller than 2% (average of 2020-2021-2022).

Construction investment growth (where available – click the arrow on the chart above) has been revised upward everywhere, but while in Bulgaria it has grown by just 0.4 percentage points, it has multiplied in Hungary, Slovenia and Romania. For the latter, it has even exceeded 8% per annum. Construction’s share in total investment in EECFA countries and Hungary ranges from 55% (Bulgaria) to 64% (Romania), with Hungary and Slovenia in between (62% and 59%, respectively).

All these represents the Commission’s opinion. If you are curious about our opinion on Eastern European construction markets or you need construction forecast on segment level, please consult with the latest EECFA reports. For a sample report and order, visit eecfa.com

Q3 2020 Permit-completion results of EECFA countries

[status on 30.11.2020]

Most figures were published about Q3 2020, the period in between the 2 waves of the pandemic. Permit figures have started to recover in Turkey. In Serbia and Romania housing permit is still very high. Bulgaria is over the recent peak. Dive in the updated graphs about Eastern-European countries:

  1. Residential permit-completion (number of dwellings)
  2. Non-residential permit-completion (floor area and number of buildings)

And our forecast until 2022 is just days away, out on 8 December 2020.

Q2 2019 Permit-completion results of EECFA countries

As all Q2 figures are available, our visualizations with the 8 EECFA countries are updated.

In the Balkans, 4 out of five countries are peaking in housing permits. Especially Bulgaria, Romania and Serbia are at outstanding levels. In the meantime, Turkey has touched further lows in Q2; the quarterly permit figure is hardly higher than that of Ukraine.

Discover the full visualization at Tableau Public
Turkey: housing permit-completion, source: TUIK, EECFA

Full visualization:
1. Residential permit-completion (number of dwellings)

Ukraine and Romania are also close to their recent peaks in non-residential permits; the level of these in terms of sqm is not exceptional, though. Serbia has the big story in non-residential. Around 2.6 million sqm of permitted space (in the latest 4 quarters together) is huge, 2.5 times higher than back in 2008.

Full visualization:
2. Non-residential permit-completion (floor area and number of buildings)

Serbia: non-residential permit-completion, source: SORS, EECFA

Építésaktivitás vizualizálva – Magyarország

A posztot és a tableau viz-t összeállította: Gáspár János, Buildecon

EBI-dataviz-teljes-építési-piac

Korábban írtunk már ezen a blogon is az EBI Építésaktivitási Jelentésről, amikor bemutattuk ezen kutatásunk első eredményeit. A kutatás lényege, hogy egyedi építési projektek adataiból olyan aggregátumokat alakítsunk ki amelyek új, naprakész információt hordoznak az építési piac szegmenseinek aktuális alakulásáról. Most egy következő szintre léptünk.

Röviden a legfontosabbak:

  • A vizualizációval a három mutatószámunkat, (1) Aktivitás-Kezdés, (2) Teljesítmény, (3) Aktivitás-Befejezés, összefüggéseiben mutatjuk meg.
  • Az Aktivitás-Kezdés, hasonlóan az építési engedélyhez, un. előidejű mutatószám, azaz rövidtávú előrejelző képessége van. Az Aktivitás-Kezdés alakulása meghatározza, hogyan fog a Teljesítmény és az Aktivitás-Befejezés alakulni.
  • Az építési piac minden szegmensére látható, hogy milyen értékben indultak el kivitelezési munkák, hogy ez milyen Teljesítmény és milyen befejezési értéket eredményez. A legürdülő menük segítségével több részpiac, illetve több szegmens egyszerre is vizsgálható.
  • Érdemes teljes képernyős módban nézni, a jobb alsó sarokban lévő  ikonra kattintva tud erre a nézetre váltani.
  • 2018 3. negyedévről készült jelentés mögötti adatokat jelenítettük meg. Az azóta eltelt negyedévekről folyamatosan frissítettük a vizualizációt. Ha érdekli a legfrissebb, 2019 1. negyedéve, vagy bármilyen kérdése van, kérem írjon nekünk: ebi@ibuild.info.
  • Az alapadatok, vagyis az egyedi építési projektek forrása az ibuild.info, a mutatókat és az aggregálás módszertanát az ELTINGA és a Buildecon közösen dolgozta ki.

2016 Permit-Completion results of EECFA countries

See this summary table on how construction permit ended up in 2016 in the

  • 8 EECFA Countries where we have members
  • and in Hungary (as Buildecon is the Hungarian member to EUROCONSTRUCT)

T12+

and here you can follow the development of both permit and completion on interactive charts:

  1. Residential permit-completion (number of dwellings)
  2. Non-residential permit-completion (floor area and number of buildings)

On the residential graphs, the number of dwellings is displayed, and you can choose the countries and the data type. Besides these options, on non-residential graphs you can also choose the indicator type (floor area or number of buildings)

Beyond market feeling: 3 indicators we created for understanding better what is happening on the construction market

This post of mine appeared first on the EUROCONSTRUCT blog in mid-February and introduced one of our researches in Hungary. This research is about creating such aggregates from the data of individual construction projects which carry new, up-to-date information on the current performance of construction market segments. Since then, however, we have published our first findings for the EECFA member Romania as well. Most of the original text stands for Romania too, but there are some differences so these are included in brackets.

1_intro_normal
Thanks to The National Bank of England for the fan chart and Cosgrove Hall Films for Jamie and the Magic Torch

The regular fan-chart of The Bank of England’s GDP forecast is perfectly honest about the challenge we all face while putting together historical construction data and forecast. Uncertainty is there, not only on the right, but on the left of the dotted line as well, thanks to revisions. This post is focusing on how uncertainty surrounding the present and some months ahead in the future could be eased with aggregated construction project data. These are Hungarian and Romanian examples.

Continue reading Beyond market feeling: 3 indicators we created for understanding better what is happening on the construction market

EBI Építésaktivitási Jelentés

  • Hány darab irodaprojekt építése kezdődött meg 2016 1. félévben az országban?
  • 114 darab
  • De ebből mennyi az új építés, és mekkora a volumene?
  • 33 darab és az összes becsült építési érték 66 milliárd forint.
  • És mennyi felújítási projekt indult el oktatási épületeken?
  • 80
  • Milyen értékben?
  • 14.9 milliárd forintnyi, ami 20%-kal kevesebb, mint 2015 1.  félévében.

Az összes magas és mélyépítési szegmensre ilyen és ehhez hasonló adatokat állítunk elő egy kutatás keretében, melynek első kézzel fogható összegzése szeptemberben készült el. Az összes az jelenti, hogy a lakásépítést külön, a nem-lakáscélú magasépítést 9, a mélyépítést 8 szegmensbe kategorizálva aggregáljuk az egyedi építési projektadatokat.

Ezt a posztot egyfajta kézikönyvnek szánjuk, hogy bemutassuk milyen adatok kerültek az EBI Építésaktivitási jelentésbe.

A sajtóanyag itt elérhető: .zip (egy pdf és néhány kép)

A teljes anyag az ibuild.info oldalán olvasható (regisztáció után)

1. A fenti példát folytatva, azon kívül, hogy 114 irodaprojekt kivitelezési munkái indultak el az országban 2016 1. félévében, azt mutajuk még be, hogy ezek várt építési értéke 88 milliárd forint, és hogy ez háromszor annyi mint az előző év hasonló időszakában elindult irodaprojektek építési értéke.

aktivitas_1

Continue reading EBI Építésaktivitási Jelentés

Q2 2016 Permit – Completion results of EECFA countries

In Q2 2016 the number of permits issued in the latest 4 quarters for residential homes increased by 14% in the Balkan EECFA countries together, compared to the same period last year. Turkey registered a 10% growth in this term, while Ukraine’s Q1 2016 (latest available) figures are almost 30% up.

In case of non-residential buildings, permitted floor area remained at the same level in the Balkan as recorded a year ago, while Turkey saw a drop of 1% in Q2 2016, and Ukraine ended up 20% positive in Q4 2015 (latest available).

In Russia, residential completion of the latest 4 quarters decreased by 2% in Q2 2016 and non-residential completion stood at 1% in comparison with a year ago. (Russia-wide permit data is not available)

The updated interactive permit-completion graphs of EECFA countries are available here:

  1. Residential permit-completion (number of dwellings)
  2. Non-residential permit-completion (floor area and number of buildings)

On the residential graphs, the number of dwellings is displayed, and you can choose the countries and the data type. Besides these options, on non-residential graphs you can also choose the indicator type (floor area or number of buildings)

As we regularly issue forecasts, for us the most important question of this compilation is whether the newly incoming data are in line with our latest (short-term) forecast or not. So below we have highlighted some countries and tried to put the figures into this perspective.

  • Residential permit– Biggest growth rates: Serbia

Almost 13 thousand permitted dwellings in the Q2 2015 – Q2 2016 period translate to a 44% growth on comparable basis. This is supporting our view that completion could start increasing this year.

residential-serbia

  • Residential permit– Biggest growth rates: Ukraine

Permit reached an estimated 178 thousand in the last 4 reported quarters together, which is a 29% increase, while completion was above 110 thousand. It does not contradict our view that completion in 2016 will remain at around its 2015 level.

residential-ukraine

  • Residential completion – Biggest markets: Russia

In the Q2 2015 – Q2 2016 period 1 170 thousand dwellings were completed, a 2% drop on comparable basis. Data so far are in line with our expectations.

residential-russia

  • Residential permit – Biggest markets: Turkey

Almost 960 thousand dwellings were permitted in the last 4 quarters including Q2 2016, meaning a 10% increase compared to a year ago. Completion stood at around 725 thousand, 3% more than in Q2 2015. These are in line with our predictions.

residential-turkey


  • Non-residential permit – Biggest growth rates: Serbia

In Q2 2015 – Q2 2016, surpassing well its 2007-2008 level, 1.5 million m2 non-residential floor area was permitted, meaning an almost 100% jump from a year ago. This is supporting our optimistic outlook.

non-residential-serbia

  • Non-residential permit – Biggest growth rates: Slovenia

Slovenia is coming back from very low levels, in the Q2 2015 – Q2 2016 period altogether 735 thousand m2 non-residential floor area got permit, an increase of almost 60% over a year earlier. This is also in line with our positive outlook.

non-residential-slovenia

  • Non-residential permit – Biggest markets: Turkey

Permits for around 48 million m2 of non-residential floor area were issued in the latest 4 quarters until Q2 2016, which is virtually the same level than a year ago. This does not contradict with our soft-landing scenario. Completion is 11% in the positive territory in the Q2 2015 – Q2 2016 period against the corresponding period a year ago, but in case of non-residential sub-sector, the connection between output and completion is not as strong as in case of residential.

non-residential-turkey

  • Non-residential completion – Biggest markets: Russia

Coming down very slightly from the peak, in Q2 2015 – Q2 2016 around 30 million m2 non-residential floor areas were competed. Investment into non-residential construction has been shrinking recently, so this does not contradict our pessimistic outlook.

non-residential-russia


The interactive graphs are updated half-yearly, in between 2 report issuance. If you would like to have the row data in xls, feel free to contact us.

Data are from national statistical offices: NSI, Crostat, KSH, Insse, Rosstat, SURS, SORS, Tuik, Ukrstat

EECFA countries in the European Commission (EC) 2016 Spring Macro forecast

The Spring Forecast of the European Commission has been released, and it covers EECFA member countries: Russia, Turkey, Romania, Serbia, Slovenia, Croatia, and Bulgaria, it only lacks Ukraine from the EECFA’s coverage. The EC forecast is intensively used in the EECFA reports for assembling the macro-economic environment, and also as a demand driver in specific segments. For example, consumption leads the demand for commercial buildings in the long run, or office sector’s employment drives the need for office buildings.

In this short note we are presenting the key facts about the EECFA countries in the Commission’s report, looking at how macro forecasts have changed since 2015 Autumn.

GDP

Chart 1 GDP growth forecast of EECFA countries and the EU (average 2015-2016-2017) Source: EC

Chart 1 presents the general economic outlook in the relevant countries – GDP growth from 2015 until 2017. Turkey leads the group with a close to 4% growth, even better prospects than in autumn. Romania and Bulgaria perform better than the EU average. Serbia and Croatia are lagging behind, while Russia is in a serious recession period in the forecast horizon.

In most of the countries of the region, economic outlook has improved since the latest forecast in Autumn 2015. The biggest change in the expectation was in Bulgaria, where forecasted GDP growth increased from 1.7 to 2.5 percent between Autumn 2015 and Spring 2016. Despite the positive outlook of EECFA, we can’t be optimistic regarding Russia where GDP is likely to shrink in the next 2 years; moreover, the rate of decrease has surged since Autumn 2015.

GFCF

Chart 2 The Gross fixed capital formation growth, and if available the building construction growth (average 2015-2016-2017) Source: EC

As it can be seen on chart 2, gross fixed capital formation growth is high in EECFA, which can be explained by the GFCF’s pro-cyclical characteristic. Serbia and Romania have the biggest GFCF growth rate among the examined countries, where GFCF is set to go up between 6.8-7.8 percent. In Turkey and Croatia the estimated growth is between 2.5-3.8 percent; in Slovenia and Bulgaria growth can be between 0-2 percent. The only country where GFCF declines is Russia; the expected shrinkage is near 4 percent.

Written by Aron Horvath, PhD, Head of Research, EECFA, ELTINGA