How the full-scale war has transformed the housing market of Kyiv metropolitan region and what we can expect after it ends

Written by Prof. Sergii Zapototskyi – UVECON, EECFA Ukraine

“Between 2021 and 2026, the weighted average price of housing in Kyiv city’s secondary market rose by 11.7% compared to 43.7% in Kyiv oblast. At the same time, new housing completions in the capital city remain well below pre-war levels, while safety, autonomy, and affordability are becoming decisive drivers of demand. Does this signal a gradual shift in housing development towards the suburbs and is the metropolitan region ready for the new challenges of post-war recovery?” These are the questions that Prof. Sergii Zapototskyi, EECFA’s Ukrainian researcher at Uvecon is trying to answer.

The residential property market of Kyiv metropolitan region in 2021-2026 became an indicator of how the war reshapes the economic and spatial organisation of a large urban agglomeration. This is not merely about fluctuations in the price per square metre. Migration, security risks and disrupted infrastructure connections are changing perceptions of what makes housing attractive, along with the balance of supply and demand between the capital city and its surrounding area.

GISPro Uvecon secondary market data for September 2021 and September 2026

As per GISPro, Uvecon’s geoportal, in Kyiv city the weighted average price of secondary housing grew from USD 1,871.02/m² in September 2021 to USD 2,090.77/m² in September 2026 (+11.7%); the median rose from USD 1,554.05 to USD 1,773.47/m² (+14.1%). The number of listings in the sample rose from 28,745 to 34,967 (+21.6%), broadly reflecting the volume of recorded supply rather than the number of transactions. With cumulative consumer price inflation of around 78.4%, the nominal rise in US dollars does not imply a corresponding rise in purchasing power or real value. A figure of -37.5% can only be obtained by hypothetically deflating the dollar-denominated price using Ukraine’s consumer price index. A rigorous comparison of real US dollar prices requires a different deflator, while a comparison in Hryvnias must account for the exchange rates on the relevant dates [Sources 1, 2].

Compiled based on data from the UVECON Geoportal / GISPro.

Kyiv oblast (region) had a different trajectory. The weighted average price rose from USD 901.64 to USD 1,295.64/m² (+43.7%), a markedly faster rate than in Kyiv city, indicating a gradual convergence of price levels. However, attributing it solely to buyers “fleeing” Kyiv would be an oversimplification. The oblast-wide indicator combines the inner suburban belt and more remote districts, different building types and properties with varying liquidity. The question is the extent to which the price advantage of suburbs offsets the time cost of daily commuting, dependence on jobs in the capital city and the uneven access to social services. In this respect, Bucha, Irpin, Vyshneve, Brovary, and Boryspil are not simply alternatives to the capital city, but parts of a shared housing market in which locations compete through a combination of price, accessibility, and environmental quality [Sources 1, 3].

In September 2026, indicative secondary-market prices ranged from USD 3,217/m² in Pecherskyi District to USD 1,117/m² in Desnianskyi District, a gap of almost 2.9 times. Higher values were registered in Shevchenkivskyi (USD 2,330/m²) and Holosiivskyi (USD 2,090/m²) districts as well. This differentiation reflects centrality, building quality, transport accessibility and the concentration of services. Yet, district averages conceal considerable heterogeneity in housing stock; assessing the role of shelters, autonomous systems and security would require analysis at the level of individual buildings or micro-locations [Source 1].

Territorial shifts are evident in new housing construction statistics

In Kyiv city, housing completions fell from roughly 1.96 million m² in 2021 to 0.91 million m² in 2022. The subsequent recovery to 1.41 million m² in 2024 proved fragile: 1.19 million m² was completed in 2025, 39% below the pre-war level. Kyiv oblast, by contrast, nearly returned to its 2021 figure: 1.99 million m² over 2.04 million m². Together, the city and the oblast accounted for around 3.18 million m², or one-third of all housing completed in Ukraine in 2025.

Thus, construction activity has not disappeared from the metropolitan region, but its geography has become relatively more oriented towards the oblast. This does not automatically mean that suburban construction can fully replace supply in the capital city: new housing requires transport links, schools, healthcare facilities and utility infrastructure. Also, accurate comparisons across years must take into account changes in the statistical coverage of certain building types [Sources 4–6].

War-related damage constrains effective housing supply and increases reconstruction costs

Direct damage to Ukraine’s housing was USD 61.1 billion at end 2025 (source: RDNA5), while recovery needs reached USD 89.8 billion [Source 7]. As per data published in October this year, 4,480 apartment buildings in Kyiv have been damaged since the start of the invasion. The Kyiv Oblast Military Administration reported that by early 2025, 1,909 apartment buildings and 25,944 private houses in the oblast had been damaged or destroyed [Sources 8,9]. Yet these figures refer to different dates and geographical scales and thus should not be added together as a single current total.

Missile attack on Kyiv on 14 May 2026. Source: Ukrinform

The war has also changed the criteria buyers use to assess housing

Whereas location, layout, and transport were previously the main considerations, buyers now also evaluate the ability of the building to maintain essential functions during crises. In a nationwide OLX survey conducted in 2026, 68% of prospective buyers considered backup electricity supply important, 68% cited autonomous heating, and 60% valued an on-site shelter [Source 10].

Affordability adds an important social dimension to price

For a hypothetical 50 m² apartment, the estimated price based on Uvecon’s weighted averages was about USD 93,600 in 2021 and USD 104,500 in 2026. The ratio of this price to the average annual salary was estimated at 10.1 and 7.3 years, respectively [Sources 1, 5]. At first glance, this suggests an improvement in formal affordability. But the average salary does not represent the incomes of all households, and the calculation excludes living costs, the need to save for a down payment and actual mortgage terms. It is therefore important to distinguish statistical affordability from an individual household’s ability to purchase a home.

After the active phase of war ends, the return of Internally Displaced Persons may increase demand, while the repair of damaged buildings and constructing new housing will take time. Under this scenario, the most likely challenge is not a general shortage of residential floor space, but a structural shortage of affordable, safe and good-quality homes. Suburban areas may partly ease this imbalance, but only if transport, social services and infrastructure networks are developed in a coordinated manner.

Conclusions

Between 2021 and 2026, the Kyiv region’s housing market was characterised by moderate nominal price growth in the capital city and much faster growth in Kyiv oblast, alongside substantial disparities within the city. Housing completions in Kyiv remained below pre-war levels, while the oblast strengthened its role in regional supply.

War-related damage and growing demand for safety and autonomy are changing the qualitative structure of housing demand. A major challenge for post-war recovery may be a shortage specifically of affordable and resilient housing, requiring coordinated housing and infrastructure policies across the entire metropolitan area.

Sources

1. UVECON Geoportal / GISPro. Secondary-market apartment price indicators, September 2021 and 2026. https://gisuvecon.com/main/geoportal/

2. State Statistics Service of Ukraine. Consumer price indices. https://stat.gov.ua/uk

3. LUN. Statistics on Kyiv’s primary housing market. https://lun.ua/stat/primary/kyiv

4. Main Department of Statistics in Kyiv. https://www.kyiv.ukrstat.gov.ua/

5. State Statistics Service of Ukraine. Housing construction and wage statistics. https://stat.gov.ua/uk

6. Main Department of Statistics in Kyiv Oblast. http://www.kyivobl.ukrstat.gov.ua/

7. World Bank et al. Ukraine Fifth Rapid Damage and Needs Assessment (RDNA5). 2026. https://ukraine.un.org/sites/default/files/2026-02/P514499-22f93f3a-4278-42bc-b907-db9553d12069.pdf

8. Suspilne Kyiv. Klitschko discusses the restoration of war-damaged buildings. 16 October 2026. https://suspilne.media/kyiv/1429635-klicko-rozpoviv-skilki-poskodzenih-vijnou-budinkiv-uze-vidnovili-v-kievi/

9. Kyiv Oblast Military Administration. 2024 results: reconstruction. 1 January 2025. https://koda.gov.ua/pidsumky-2024-roku-vidbudova-na-kyyivshhyni-vzhe-vidnovleno-203-tys-obyektiv/

10. OLX. What matters to Ukrainians when choosing housing. 5 October 2026. https://blog.olx.ua/37332/shho-vazhlivo-ukraincjam-pri-vibori-zhitla-golovni-kriterii-kupivli-ta-orendi-u-2026-roci/

What does Bulgaria’s euro adoption mean to the country’s residential construction?

Written by Yasen Georgiev (EPI, EECFA Bulgaria)

“Can we already estimate what the immediate effects of Bulgaria’s euro adoption are on the residential construction of the country? This is one of the most frequently asked questions we try to answer almost on a daily basis in our talks to construction companies in Bulgaria. And the short answer is – probably yes. The longer one is – it depends on which data we look at and their latest availability” – says Yasen Georgiev, EECFA’s Bulgarian researcher at Economic Policy Institute.

Residential complex in Manastirski Livadi, East district, Sofia. Source: unsplash.com

After almost 30 years of having its currency pegged firstly to the Deutsche Mark, and later on to the Euro with a fixed exchange rate, on 1 January 2026 Bulgaria became the 21st member of the euro area. This heavily impacted residential construction and it witnessed the all-time highest number of completed residential buildings and dwellings in 2025. To this contributed the combination of several well pronounced factors – widespread concerns about the overall price increase after the currency changeover, existing inflationary pressure, favorable financial conditions, and the considerable amount of cash that needed to be invested quickly and under some less transparent conditions.

Ever since this historic moment, it has been the release of quarterly data on the performance of the residential segment that has attracted public attention. Has the highest point been reached? Has the growth curve levelled off? Data on home transactions for January-September 2026 show it clearly – property transactions in Bulgaria are on the decline. What is more, the pace of decline itself is accelerating. In Q3 2026, 45,312 property sales were registered, 22% fewer than the 58,184 recorded a year earlier. In Q2 2026 the annual drop was 18% and in Q1 this year it stood at -15%. This, however, does not tell the whole story.

The latest available data on construction permits, starts, and completions is much more nuanced. When floor area is considered, permits increased in Q1 2026 by 33% and in Q2 this year by 4% on an annual basis, while started area grew by 58% and 9%, respectively. In parallel, completed floor area contracted by 44% in January-March this year and by 24% in April-June 2026. What is consistent, though, is that the peak performance in these three categories seems to me be over, at least for now.

Against this backdrop, as data by the Bulgarian National Bank shows, new housing loans continued to grow. In August 2026 their volume was 21% higher than in the same month last year amidst credit activity being backed by continuously low interest rates. 

All this comes to show that drawing any conclusions right now on the implications of the euro adoption of Bulgaria on its residential construction might turn hasty. Thus, the question of what the future direction of the segment would be remains open, at least for the moment. A clearer and more definite answer will be given on 8 December 2026 when EECFA publishes its winter construction forecast report. For sample report or orders, contact us.

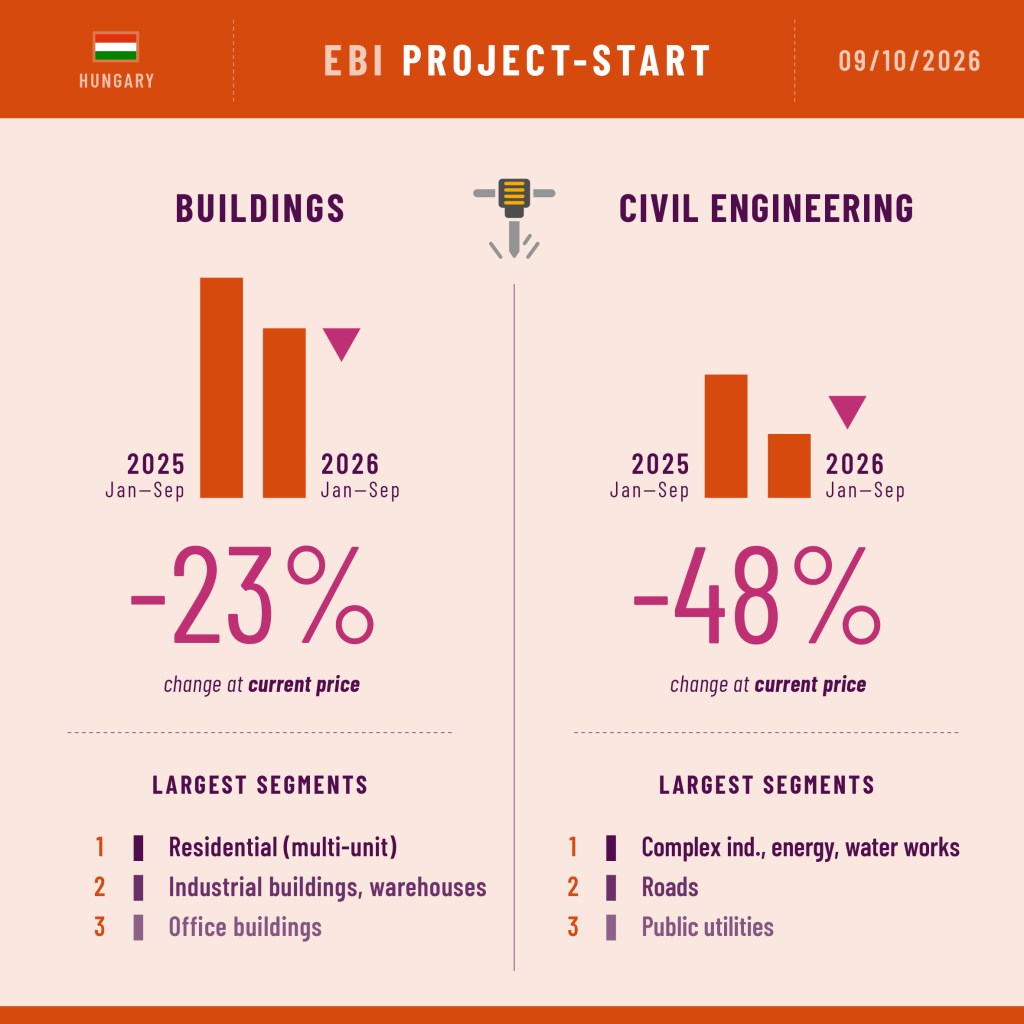
EBI Hungary – megkezdett kivitelezési munkák – 2026. október 9.-i állapot

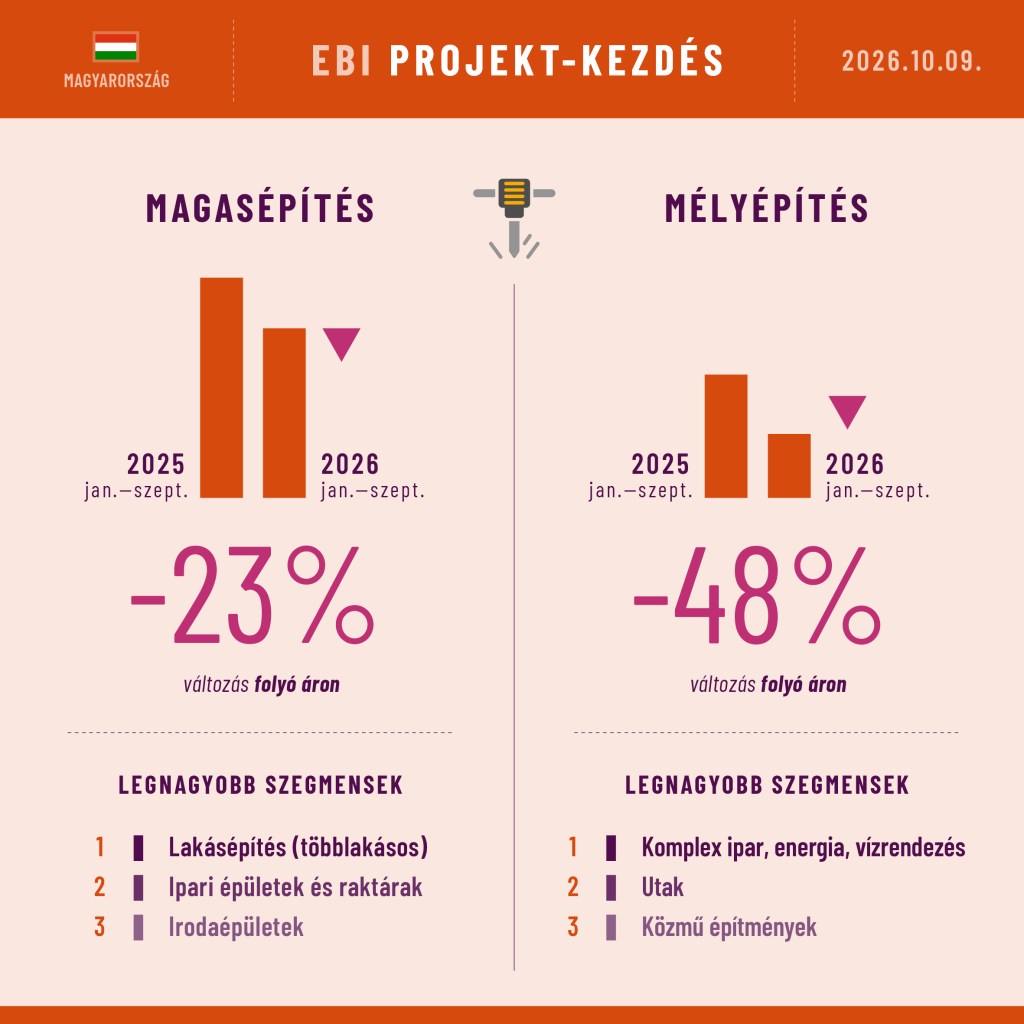
A magasépítés két részpiaca közül a nem-lakáscélú néz ki rosszabbul. A Projekt-Kezdés itt már negyedik éve csökken még folyó áron mérve is. Az egyetlen jó hír, hogy az ipari épületek és raktárak szegmens kezd stabilizálódni a nagy visszaesés után. A társasházi lakásépítés részpiac is visszaesett. Itt azonban éven belül történt fordulat; a nagyon erős év eleji Projekt-Kezdést két gyenge negyedév követte.

A megkezdett mélyépítési munkák összértéke a három idén indult erőmű építése ellenére visszaesett tavalyhoz képest. Igazán nagy közlekedési projekt még nem indult idén.

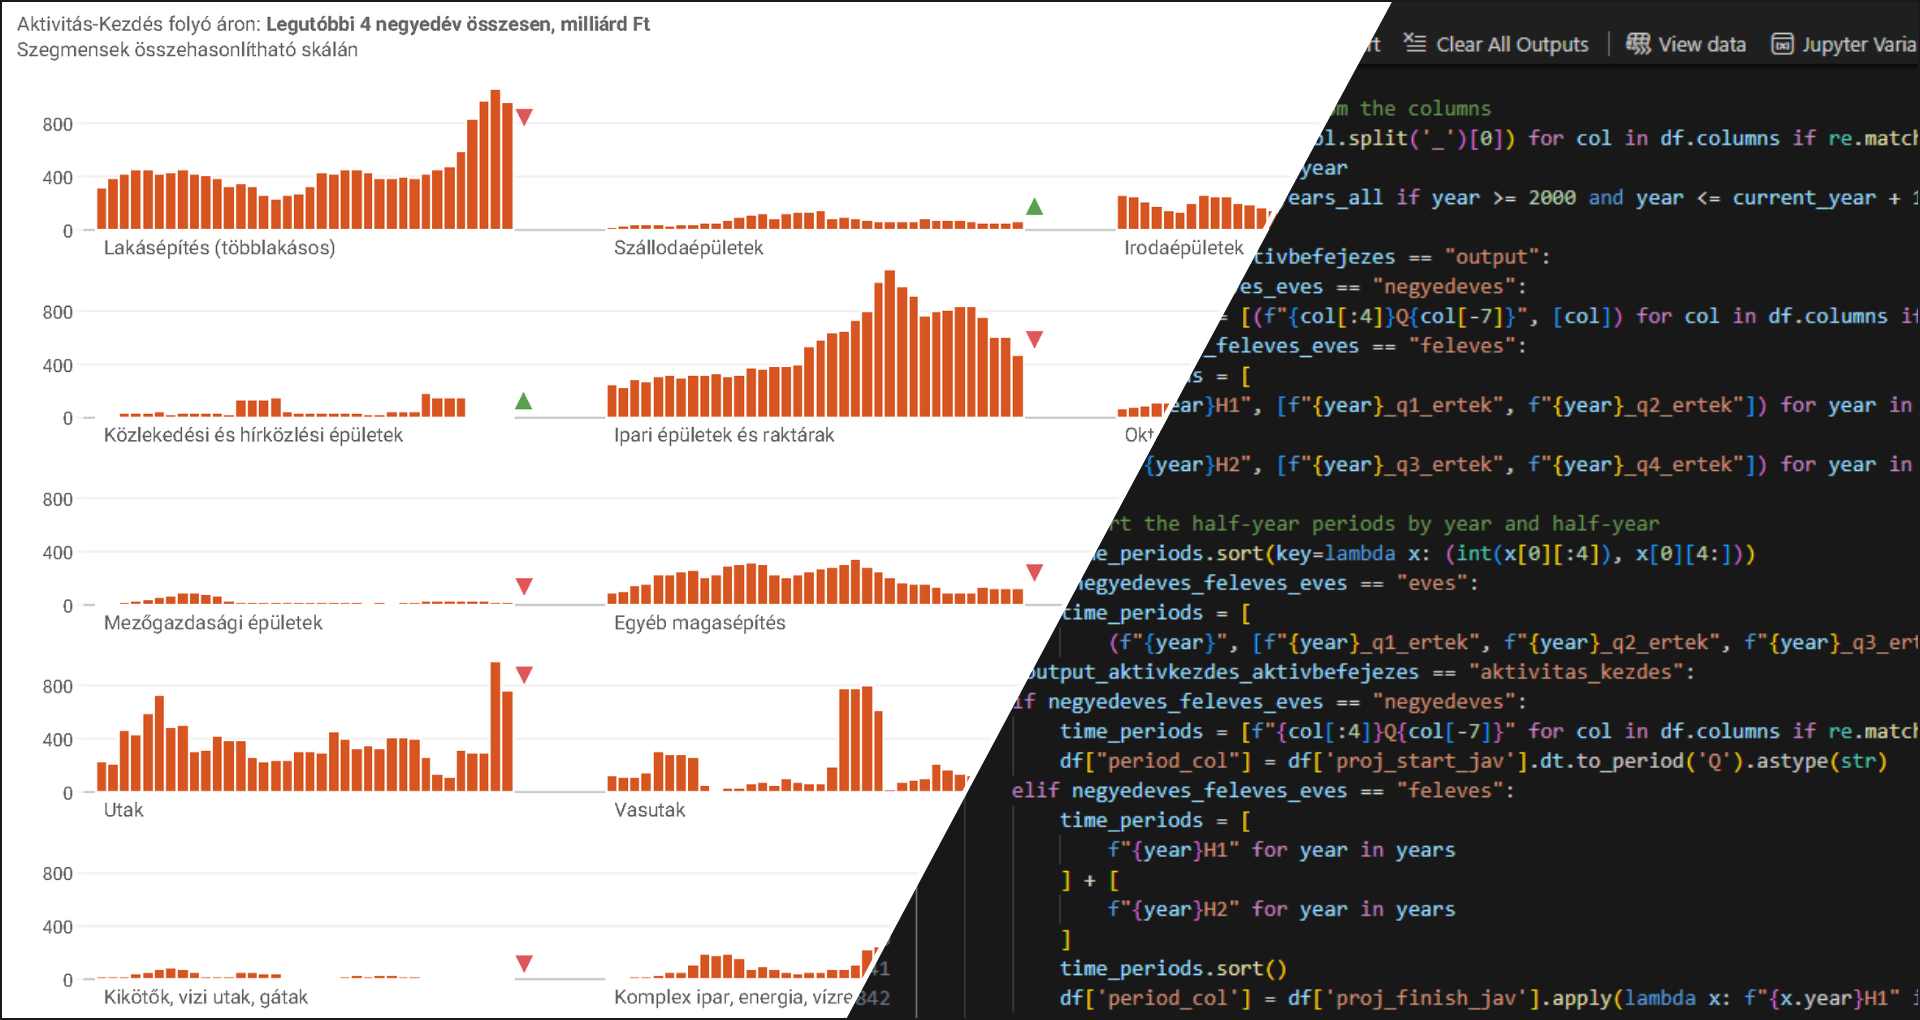
A poszter a két nagy építési részpiac Projekt-Kezdés indikátorának időszak/időszak változását mutatja, valamint a szegmenseket amelyekben a legnagyobb értékben indultak kivitelezések. Ezt a posztert minden hónapban kitesszük ide a blogunkra. A teljes építési piacot részletesen bemutató EBI Építésaktivitási Adatvizualizációt (összesen 18 szegmens adataival) is havonta frissítjük, és negyedévente az EBI Építésaktivitási Jelentésben is elmondjuk, hogy mit látunk a piacon. Ha érdeklik a részletek akkor a contact oldalon írjon nekünk.

Out of the two submarkets of building construction, non-residential is faring worse. Project-Start in this area has been declining for four consecutive years, even at current price. The only good news is that the industrial buildings and warehousing segment is beginning to stabilize following a sharp downturn. The value of started multi-unit residential projects has also been shrinking. The turnaround of this submarket happened only this year. A very strong year-start was followed by two weak quarters.

Despite the commencement of three power plants, Civil Engineering Project-Start is well below its last year’s level. No major transport project has been launched so far this year.

The poster (above) shows the period/period changes of the Project-Start indicator in the 2 main submarkets and the segments with the largest value of started works. This poster is published every month here in the blog. The EBI Construction Activity Data visualization with the details on the whole construction market (with altogether 18 segments) is also updated monthly and the EBI Construction Activity Report, summarizing what’s happening in the market, is published in each quarter. If your interest in construction markets is deeper, please contact us for the details.

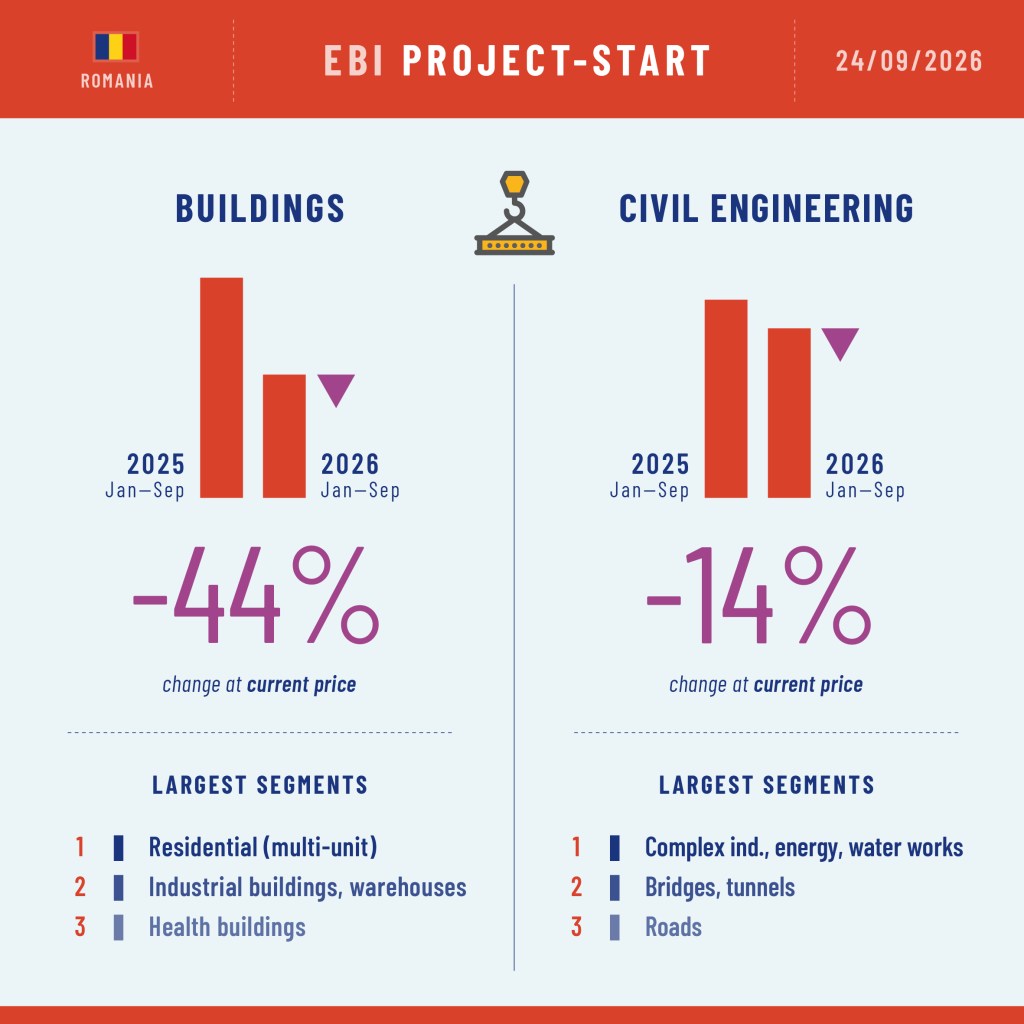
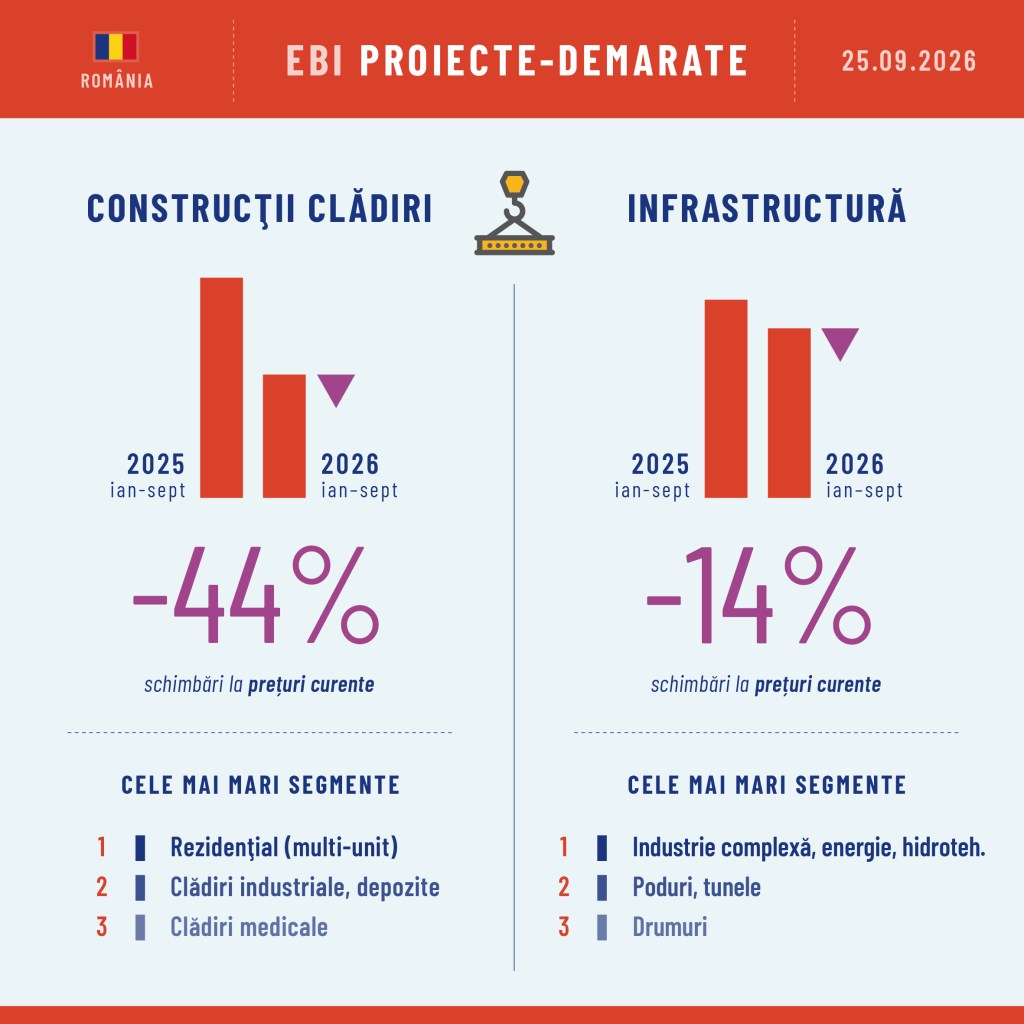
EBI Romania – started construction works – 24 September 2026

There was no construction start indicator in Romania, so we have created an estimation for it.

This poster is a summary of our monthly findings. It shows how the total value of started construction works have changed over the same period last year. Besides, it presents which segments have the biggest start value in the current year. We call this indicator Project-Start. And they are computed every month for 18 construction segments by aggregating data of construction projects. The projects are from the iBuild database and ELTINGA and Buildecon found the way of creating indicators out of them.

If you need short-term foresight, you will like it.

Brief comment from Janos Gaspar, head of Buildecon:

Project-Start has been very low so far in the building construction submarket in the third quarter. In each segment of this submarket, the value of commenced construction works is lower than in the same period last year. This could change significantly, though, as a great deal of information on this quarter is yet to come in. The civil engineering submarket looks more promising, primarily due to a few massive wind and solar power projects.

Every month this poster will be available here on our blog. If your interest is deeper, we have the EBI data visualization (with indicators for all the 18 segments of the construction market), updated monthly and we have the EBI Construction Activity Report Romania (with data and explanations), published quarterly in English and in Romanian. All these are packed into a yearly subscription. For the specifics, please contact us.

The Russian multi-unit housing market: a consensus forecast up to 2030

Written by Andrey Vakulenko – MACON, EECFA Russia

As the residential real estate market in Russia continues to struggle with high key rates and expensive mortgages, the main question in the coming years is not so much the expected rate of reduction, but the speed of this reduction and how quickly market mortgages can replace shrinking preferential programmes. Based on data from ten major think tanks, MACON has compiled a consensus forecast for the multi-unit housing market over the next five years.

Fundamental framework for the housing market in the coming years remains quite conservative

Key forecasters—the Bank of Russia and the Ministry of Economic Development—both predict that inflation will gradually decline, but at high stakes, causing a general economic cooling and minimal growth in the coming years. Expected GDP growth in 2026 is to be 0%-1% annualised, accelerating to 1.5%-2.5% in 2027-2028.

The key rate is forecasted to average 14.6% in 2026, with a further decline to 10.5%-12.5% ​​in 2027 and to around 9% in 2028. In early 2026 a more pronounced rate cut was expected, but by July the trajectory of monetary policy easing had become noticeably more restrained. Inflation is falling at a slower pace than planned, so the Central Bank is also lowering the rate more slowly.

Market mortgage rates will also likely decline, but gradually rather than sharply, which is crucial for the housing market: the cost of financing remains one of the main factors determining home purchases.

Baseline consensus forecast for the multi-unit housing market

Multi-unit housing market forecasts made at the beginning of 2026 by 10 different sources have been complied: rating agencies (ACRA, Expert RA), banks (Alfa-Bank, Sovcombank), institutional companies (DOM.RF, ЕРЗ – erzrf.ru), consulting companies (Yakov and Partners, Strategy Partners, MACON) and the Centre for Macroeconomic Analysis and Short-Term Forecasting (CMASF). The consensus forecast has been broken down to five key indicators: housing completions, new project starts, new mortgages, primary market sales and prices in the primary market. If we combine the forecasts for all five indicators, we get a fairly consistent picture of a gradual recovery cycle:

  • 2026: stabilization – demand is to stop declining, mortgages are to begin to recover, although development activity is to remain under pressure.
  • 2027: start of recovery – mortgage market may grow, demand may increase and developers may begin to start new projects more actively.
  • 2028: turning point in supply and development activity – recovery in demand and new project starts should begin to be reflected in housing completion.
  • 2029–2030: a period of stable growth – the rate of increase for most indicators will likely moderate and the market is likely to gradually enter a stable trajectory.

The logic here is that the recovery of the mortgage market should support demand, growth in demand would halt the shrinkage in development activity and first, new project starts would grow, and after a few years this effect would start to show in housing completion.

Prices in the primary market remain the most stable element of the forecast. There are not enough preconditions for a sharp increase, but there are no grounds for a large decrease either. High construction costs and financing costs will form the lower price limit, while limited purchasing power, amid a gradual decline in rates, will form the upper price limit.

Thus, the coming years are more likely to bring a gradual recovery than a new boom in prices and development. As the market will not return to the previous model based primarily on mass, preferential mortgages and demand will be more and more generated by market lending, the decline in key and market mortgage rates is the main factor in forecast uncertainty. So, the market remains quite sensitive to decisions in ​​monetary and mortgage policies.

Alternative scenarios of the consensus forecast

Since the range of expert opinions on a number of indicators for 2026 turned out to be quite large, we can identify not only a basic consensus forecast, but two alternative scenarios as well. Differences between the two scenarios mainly concern 2026 as in subsequent years forecasts for most indicators converge much more closely:

  • In the pessimistic scenario, demand recovery in 2026 is significantly weaker. Mortgage lending would grow by only 7%, primary market sales would drop by 13% and new project starts would fall by almost 15%, limiting growth for housing construction in 2028.
  • In the optimistic scenario, more rapid monetary easing and the maintenance of the Family Mortgage Programme terms would allow the mortgage market to grow by 17%, and demand by 2%. Developers could increase new project starts by 15% as early as 2026, leading to higher growth in housing completions (about 12% in 2028).

Key indicators in the consensus forecast

Housing completion volumes are to go down by 5% in 2026 and by another 8.5% in 2027, followed by a gradual transition to growth: +3.8% in 2028 and +7.6% in 2029. Thus, 2026-2027 is a correction phase and 2028-2030 is a period of recovery in developer activity. Experts generally agree on the direction of future trends but differ on the estimates of their scale. There are two scenarios for 2028: in the positive one, completion could grow by about 12%, while in the negative one, only by 1.5%.

The highest uncertainty is in new project starts. The difference in expert estimates is based on different assumptions about developers’ reactions to the current market situation: the decision to start a new project is sensitive to demand, the cost of project financing, construction costs, and expectations of future sales. So, the divergence between the scenarios is the most noticeable here. In the optimistic one, new project starts in 2026 could grow by 15.3%, while in the pessimistic scenario, they could drop by 14.5% (the consensus is -4.6%). So, the market is at a point where developers are beginning to look beyond the current decline in demand but are not yet confident in the speed of its recovery. Starting in 2027, experts are much more unanimous in their expectations with a stable growth of 5%-10% per year.

The most positive dynamics are expected in new mortgages where the consensus forecast is +12% in 2026 and +24% in 2027, followed by +12%-13% annually in 2028-2030. However, the forecast for the current year remains less certain than expectations for 2027-2030. The optimistic scenario projects a growth of 17% in issued mortgage loans for 2026, while the pessimistic scenario projects only 7%. The difference is mainly due to the differing expectations regarding the pace of monetary easing and the availability of market mortgages. Going forward, as rates decline, market mortgages should gradually become the primary source of demand.

The consensus estimate is that primary market sales in 2026 can grow by just 1%, suggesting that rate cuts are not yet enough to fully restore demand, but experts don’t expect a further decrease. However, there is also a negative scenario: the possible tightening of the Family Mortgage Programme could lead to a drop in the number of transactions by about 13% as early as 2026. For 2027-2029, the number of transactions is to grow by 7%-9% per year, while it is to slow down to 4% in 2030.

Prices in the primary market appear to be the most stable element of the forecast. Consensus forecasts are for the price per square meter to add 6%-8% per year in 2026-2028, followed by 5%-6% per year in 2029-2030. One could ask why prices continue to rise even with limited demand. On the one hand, growth potential is limited: purchasing power remains a restraining factor, and the level of sales in projects under construction is relatively low. On the other, developers face high construction costs and high project financing. Thus, there is limited room for price reduction, and the most likely scenario is a moderate nominal price growth without a sharp acceleration.

How does the forecast compare with the reality so far?

Based on the results of H1 2026, actual demand almost perfectly matched the consensus forecast. This applies to both primary transaction volume and the mortgage market.

Price dynamics are also relatively close to the forecast range, although the direction is still different: experts anticipated moderate price growth by the end of the year, while the first half of the year showed a nominal negative correction.

Development activity is better than expected. Both housing completions and new project starts showed growth between January and June 2026 despite the consensus forecast for a moderate decline for the year. The discrepancy in multi-unit housing completions is particularly noticeable: the actual dynamics of H1 exceeded even the most optimistic expectations.

Yet, as the first-half-year results are not representative of the year and some indicators exhibit significant seasonality, it doesn’t mean that the forecast needs to be fully revised. It indicates though that market supply is demonstrating greater resilience than hoped for.

Methodological approach to the consensus forecast

The methodology is based on the median of all available forecast estimates for each indicator. The median was chosen deliberately: unlike the mean, it is resistant to outliers and better suited to the real estate market where expert estimates often greatly differ.

To assess the extent to which experts agree with each other, the interquartile range (IQR) is used—the difference between the third and first quartiles of the sample. It shows how widely opinions differ regarding the central range of forecasts. The smaller the IQR, the greater the agreement among opinions and the greater our confidence in the consensus estimate. The assumptions used to interpret the results were: IQR < 3%: very high predictive certainty; 3–6%: high predictive certainty; 6–10%: moderate;10–15%: low; over 15%: very low.

Where consensus estimates are low, the consensus forecast is supplemented with optimistic and pessimistic scenarios constructed based on the upper (third) and lower (first) quartiles, respectively (the optimistic scenario focuses on the upper part of the expert estimate range, while the pessimistic scenario focuses on the lower one). This way, uncertainty can be conveyed through a single figure, and a realistic range of possible market development can be shown.

Q2 2026 Permit-Completion in EECFA area

The viz was updated on 16 September 2026.
→ Ukraine published its Q2 permit figs and they look good.

In Serbia there is lasting optimism, but in Croatia there has been some shrinkage lately. These countries experienced massive permit expansions between 2014 and 2022 and they have remained at around their peak for quite a while. Serbia has had around 7 million permitted m2 (residential and non-residential combined) for over four years and Croatia had been above 4 million for three years since 2023. It is no longer true due to the worsening non-residential permit figures. Slovenia remained below its 2022 peak despite some positive correction in H1 2026. Expansion continued in Bulgaria, the 9 million m2 (record of the last 15 years) has been surpassed. Recovery in Romania and in Hungary paused in Q2 because of the drop of non-residential permits.

You may use the dropdown in the viz for selecting either the residential or the non-residential submarket, or both.

See the full viz: EECFA Permit-Completion Quarterly – 16 September 2026

In the full visualization, not only permit but completion data can be followed (where available). Just click on the Country-by-country sheet.

Despite the slight correction in residential segment, figures in Türkiye are still extreme. More than 1.2 million dwellings obtained construction permit in the last 4 quarters. (From Q2 2025 on, permits issued by authorities other than the municipalities are also published by TUIK. So the scope is bigger, the results show the full picture. Click through the below viz for understanding the size and the impact of this revision.) Q2 2026 has been the best quarter in Ukraine since the beginning of the war. This was the second quarter, however, when residential was not able to grow. The expansion is driven by the increasing permit figs of non-residential buildings. Russia is relatively stable when it comes to building completion. There is slight uptrend in non-residential and a downtrend in residential.


This visual about the significance of the permit revision in Türkiye was compiled back in September 2025.

Shrinking Project-Start in Romanian construction market

Written by Dr. Sebastian Sipos-Gug – Ebuild srl

The value of newly started construction projects in Romania was much lower in the first half of 2026, according to the latest EBI Construction Activity Report Romania, with Project-Start in decline across almost every submarket. “Q1 was relatively strong, but not enough to change the overall downward trend. A combination of economic slowdown, persistent inflation, elevated interest rates, and reduced public spending continues to constrain the market” – says Dr. Sebastian Sipos-Gug.

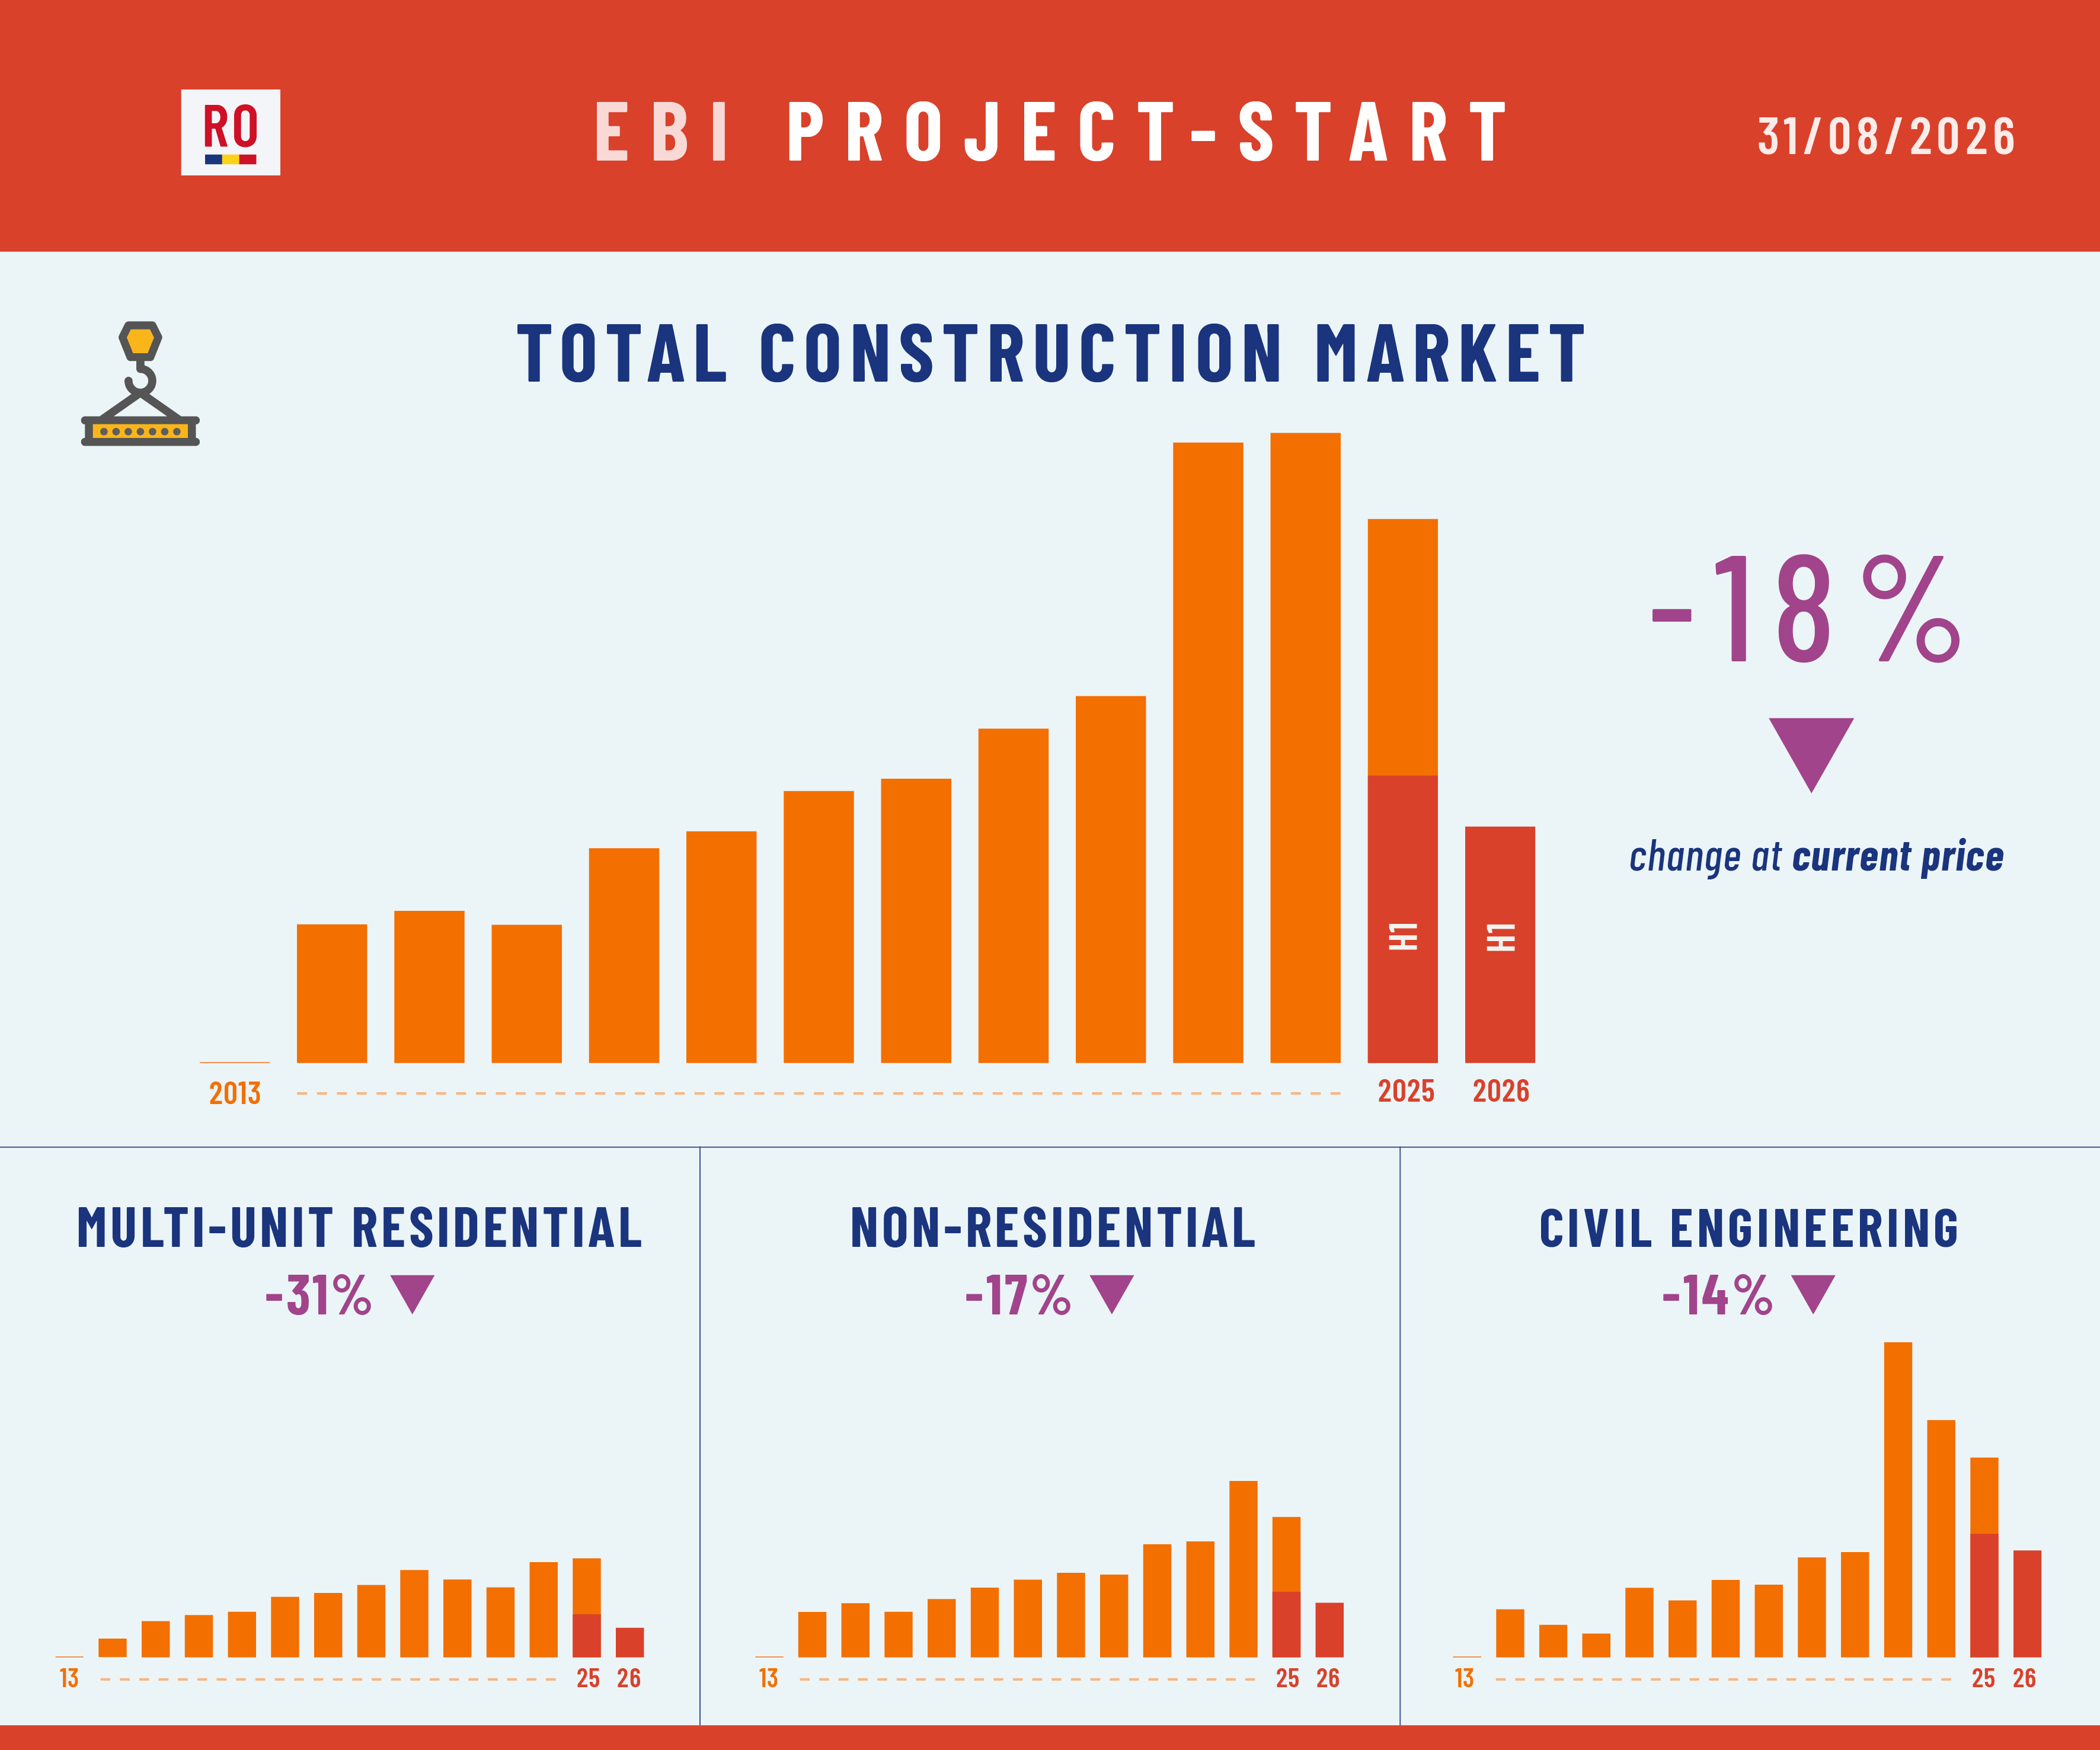
The total value of commenced multi-unit residential projects experienced the largest drop (-31% compared to H1 2025) as developers face more difficult financing terms and cooling market demand. Home prices are rising more slowly than inflation or construction costs, which also makes residential projects less appealing for speculative development. The ransomware attack on the land registry database also hindered new construction, since it froze property transactions, mortgage contracts, land surveys and construction authorizations for weeks. As the administration will have to handle the backlog created during the shutdown in addition to new requests, the situation is unlikely to improve for the remainder of the year.

Project-Start also fell in case of non-residential construction, though at a more moderate pace (-17% year-on-year). Performance within the submarket was uneven: publicly funded buildings, particularly in healthcare and education, were behind much of the decline as government investment comes under strain from austerity measures and the focus on ongoing NRRP-funded projects. The private sector is showing signs of strong resilience, as evidenced by the detailed breakdown in the report (for instance, the remodeling of mall Palas Iasi started in Q2 2026, at an estimated value of EUR 80mln), and could help the submarket weather this period of poor performance.

The infrastructure submarket fared the best of all three, but it still declined significantly (-14% year-on-year) since new projects took a backseat in favor of completing existing works, with the administration focused on increasing absorption before the August 2026 NRRP deadline. The ongoing government crisis has further complicated both the launch of new projects and the financing of those already underway, but a ramp up of the 2021-2027 EU funding programs could help sustain the submarket by the end of the year. For instance, in H1 2026 construction started on the renovation of one of the oldest railroad connections in the country: Bucharest North – Jilava – Giurgiu North – Giurgiu North Border (55 km), with EUR 423mln co-funded from the CEF 2021-2027 budget.

Q2 data pointing to a weakening construction sector in Hungary

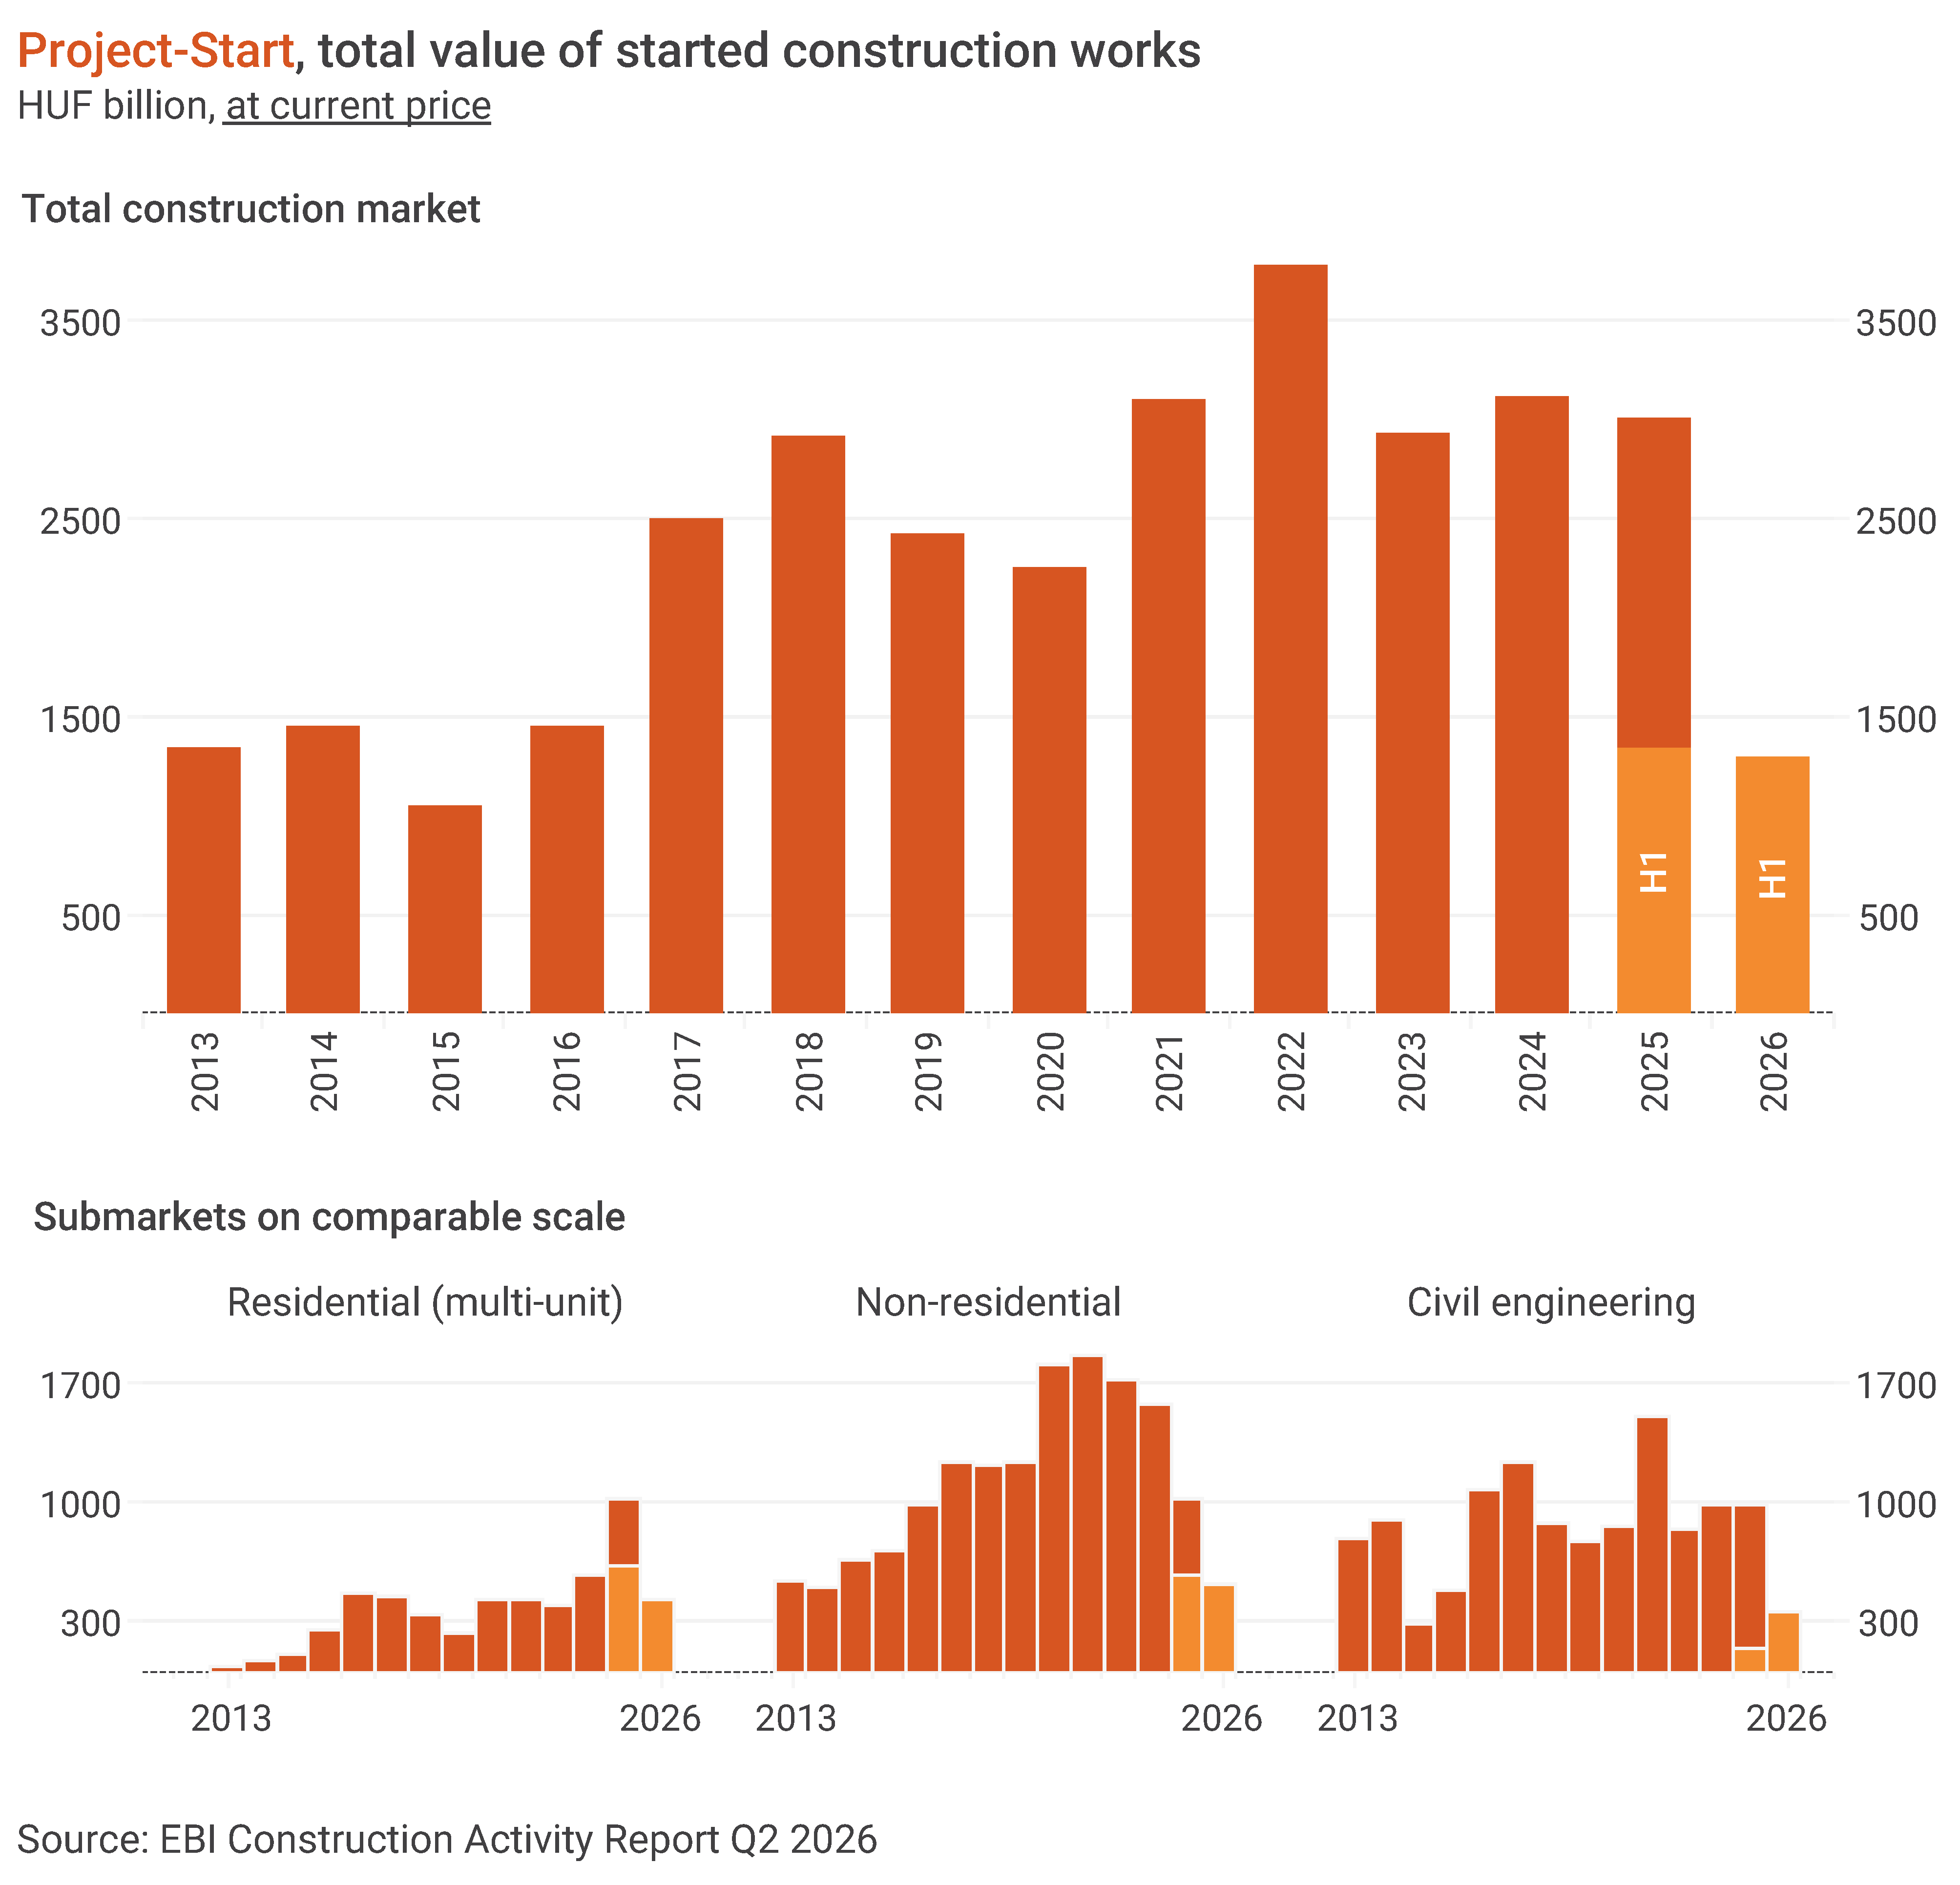
Although Q1 data suggested that early 2026 started well for construction, in Q2 the sector saw a way more moderate investment mood: the level of Project-Start shrank to roughly half of the Q1 level. The latest EBI Construction Activity Report found that projects worth less than HUF 470 billion started – the third lowest value since 2021. The value of construction projects started in Q2 was about 41% lower than the average three-month value​​​​ between 2021 and 2026. Thanks to the outstanding Q1 figures due to Paks 2 and the high number of multi-unit residential project starts, however, the overall level of Project-Start in H1 is still not drastically low: the drop is just over 3% like-for-like. Yet, compared to the first six months of 2021-2024, the decline is between 17% and 45%.

Building construction: Q2 brought much lower Project-Start than Q1

As per the latest EBI Construction Activity Report, the value of projects entering construction in Q2 did not reach HUF 350 billion, making it the second worst quarter since 2021. Looking at the first half of the year, the Project-Start of less than HUF 1,000 billion at current price has been the lowest level since 2021, falling 10%-27% short of the figures of the first 6 months of the past 6 years. Although Q2 brought lower Project-Start ​​for both multi-unit residential and non-residential buildings, the latter did not post such a radical drop. Overall, non-residential projects worth slightly more than HUF 500 billion entered construction during H1 2026 – the lowest level in the past 6 years and 10%-52% lower than in the same period of previous years.

Among the biggest non-residential projects launched in Q2 2026 was the construction of Airport Service Centre Office Building, Phase 2 of Petőfi Theatre in Veszprém, and several logistics ones such as Phase2 of CTP logistics park in Érd, the next phase of the Weerts Logistics Centre project, as well as the final works of Phase 2 of Kecskemét Campus.

Civil engineering: projects launched at a much lower value in Q2

Owing to the high Project-Start due to the Paks 2 project in Q1 2026, in Q2 the value of Project-Start slightly exceeded HUF 120 billion. Started projects were primarily non-road and non-railway projects, with the largest being the combined cycle gas turbine power plant in Visonta and the hybrid geothermal power plant in Zsana. Project-Start in the road and railway segments continued to be at a minimal level where the biggest project was the Baja southern bypass and junction.

Central Transdanubia overtaking Budapest

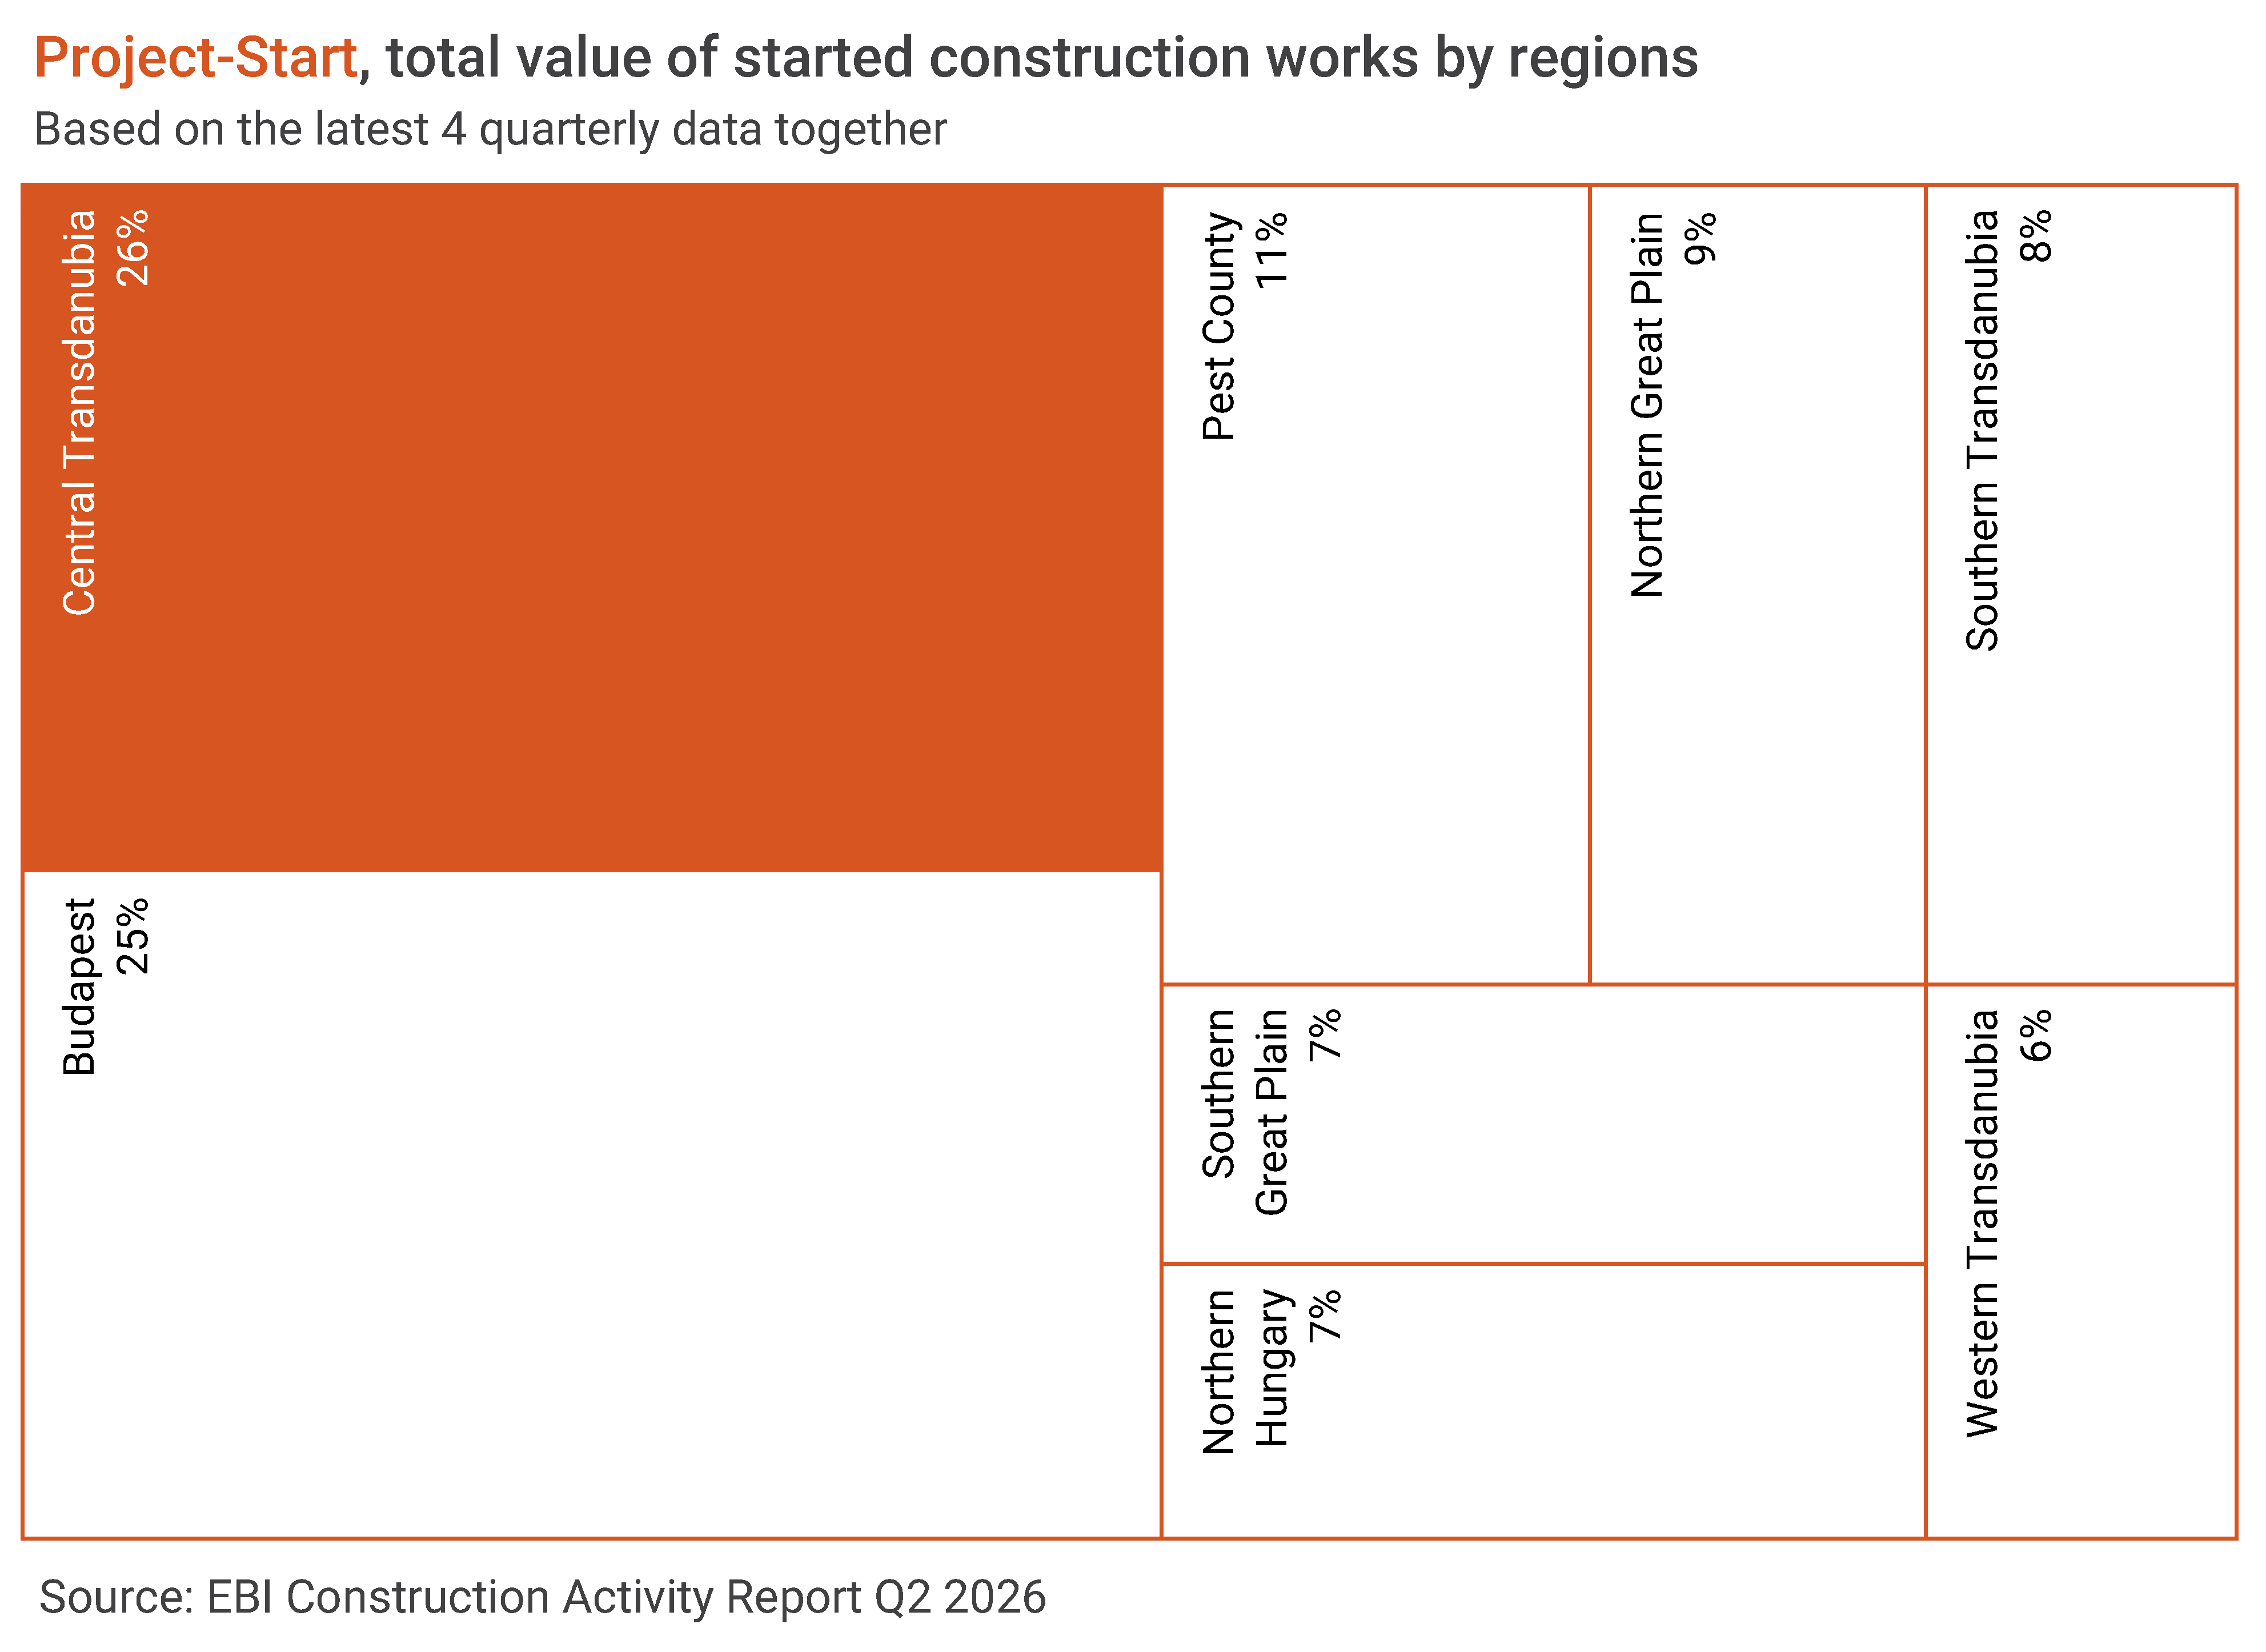
Looking at construction projects launched in the past four quarters, the biggest-value ones started in Central Transdanubia, largely due to the M1 motorway expansion that started in Q3 2025. The region’s share grew to 26%, exceeding the capital city (25%). The lowest value of Project-Start was in Western Transdanubia (6%), while the share of other regions ranged between 7% and 11%.

Decline in the value of started multi-unit constructions in the second quarter

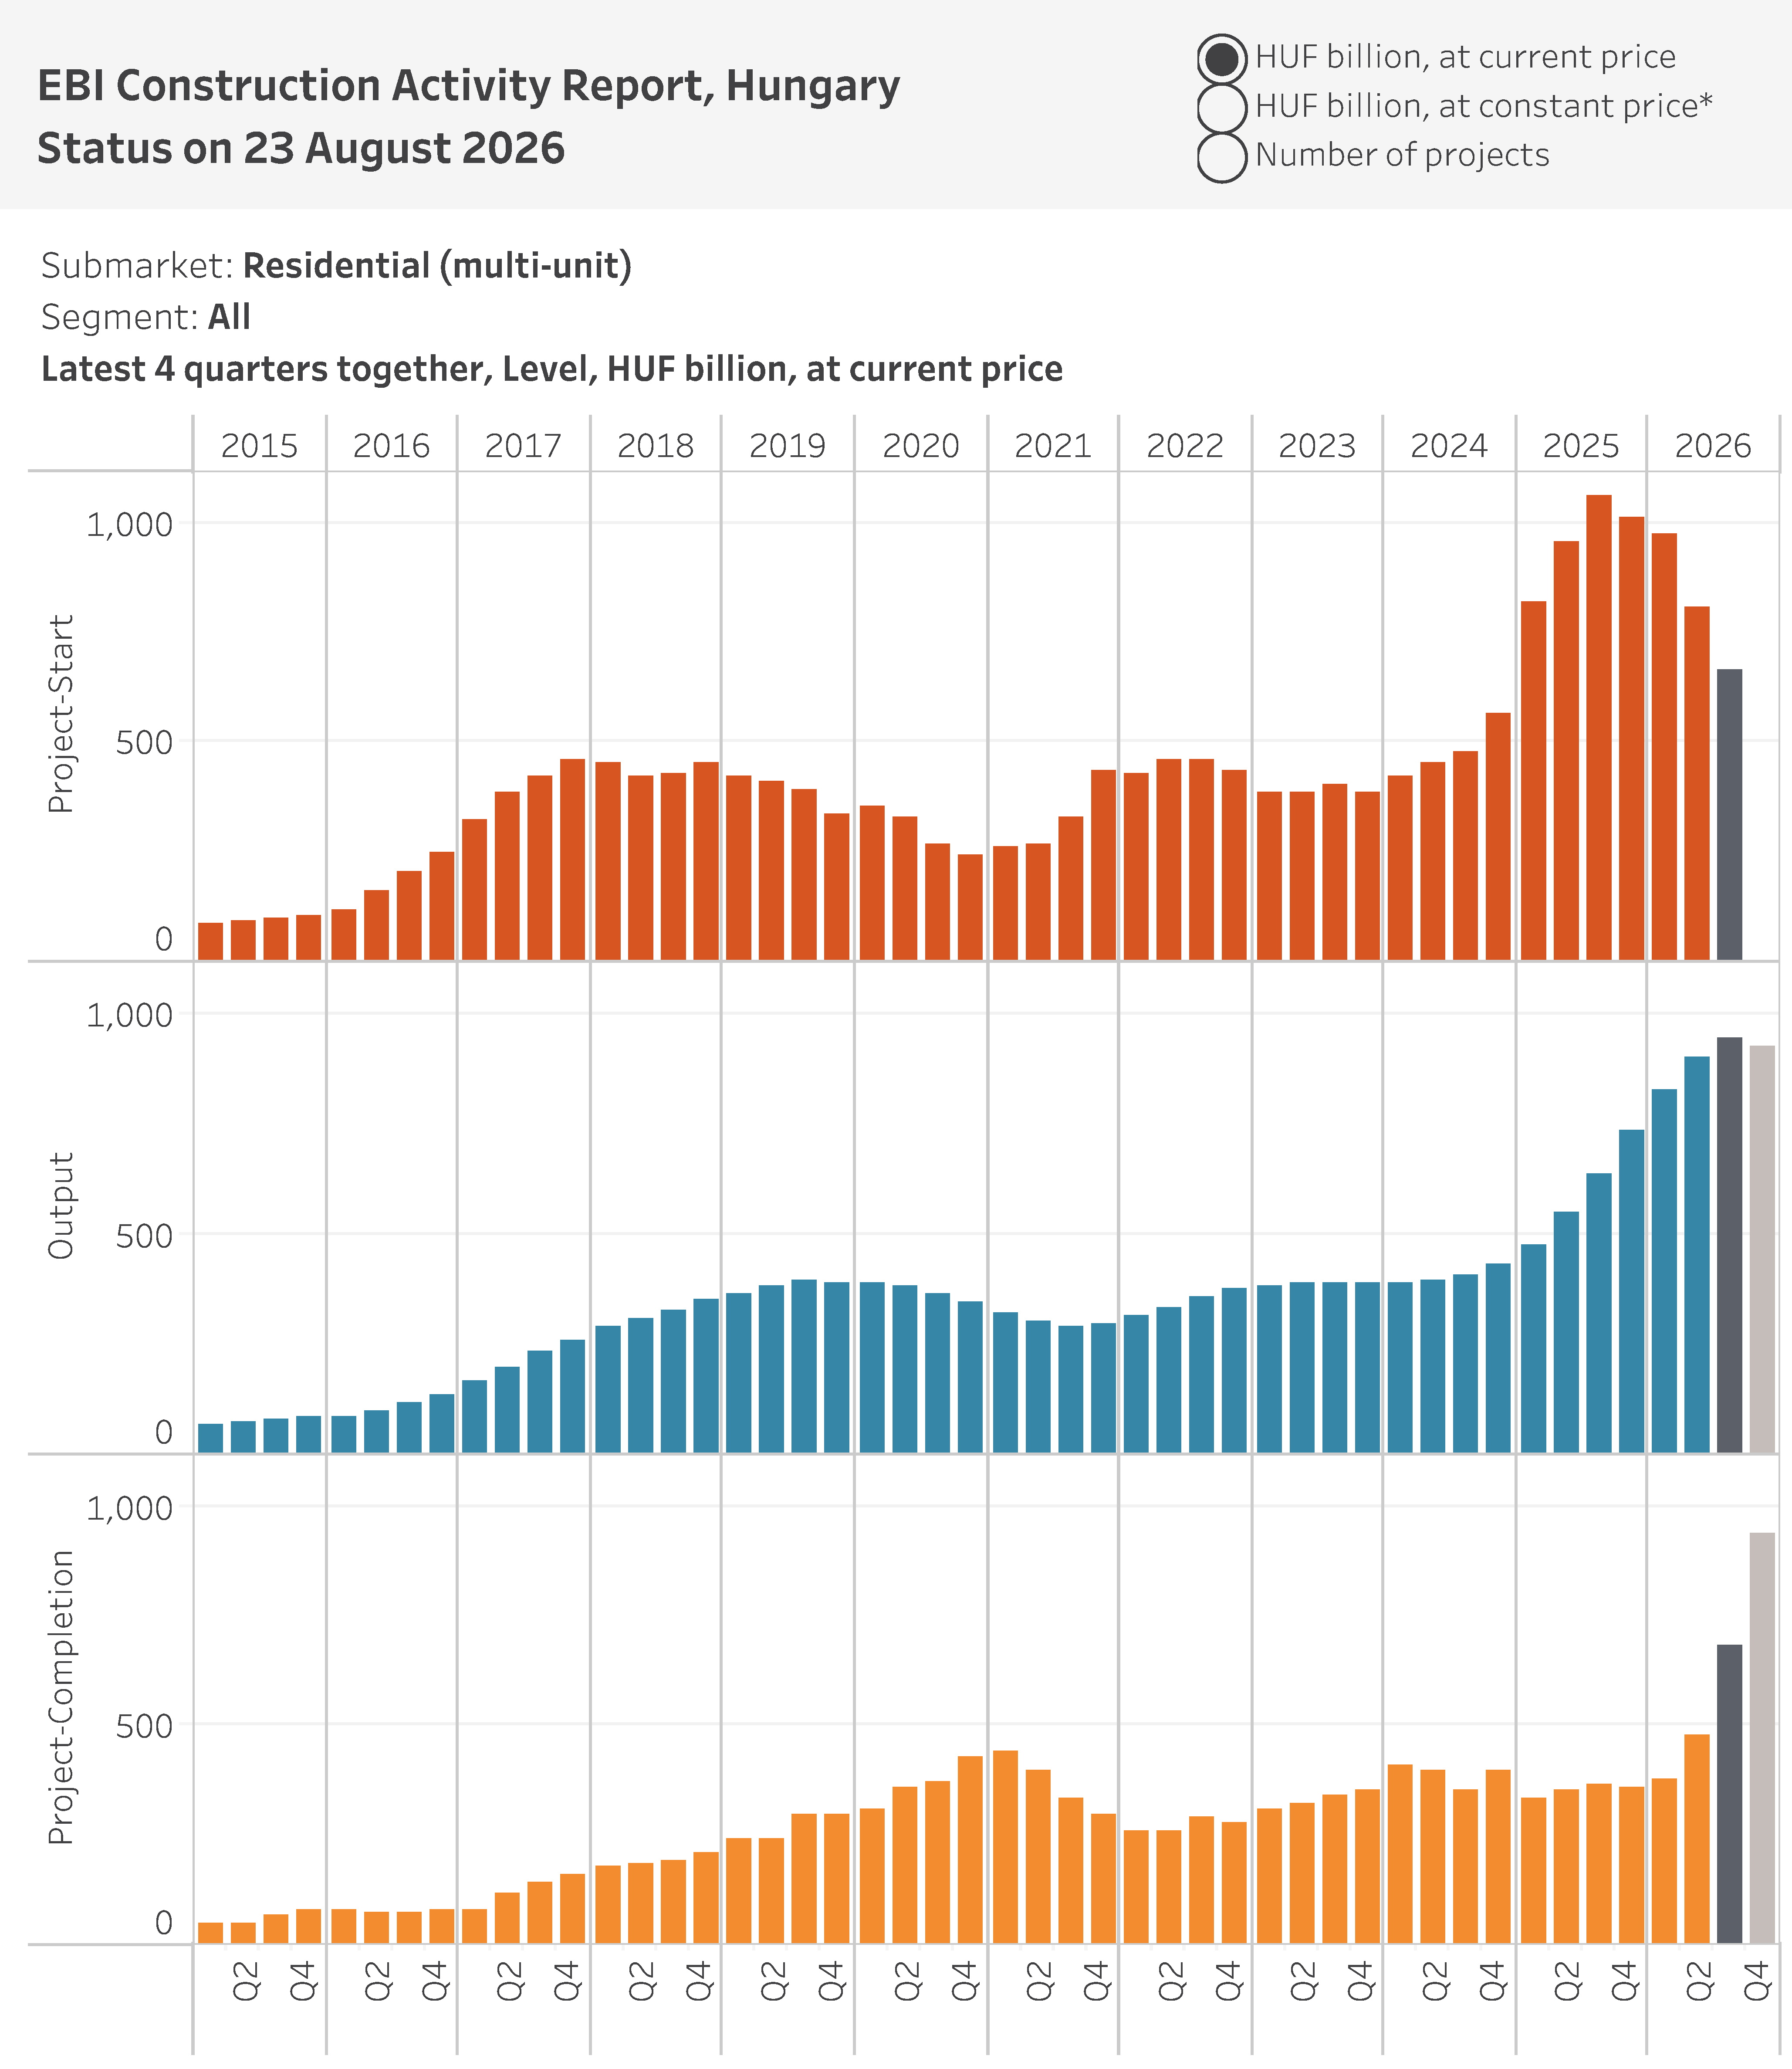
According to the latest EBI Construction Activity Report, multi-unit residential Project-Start barely exceeded HUF 100 billion in the second quarter of this year, which was unprecedented in the past two years. But because construction works in the segment started at a great value in Q1 2026, the figures of the first half year in 2026 overall, even at constant price, only show a 35.5% decline like-for-like. Also, started multi-unit residential works far exceeded the first half-year levels of the years between 2019 and 2024.

Several factors are behind the more subdued project starts in Q2. First, some correction was expected after the near-record Q1. Second, developers may have become more cautious with project starts due to government change and moderate demand. Q3 will also bring lower Project-Start, and reduction is expected for the rest of the year. The suspension and review of certain projects that previously received state support under the Home Start Program is also delaying construction start, which may affect 17 000 dwellings. As of now, little is known about the newly announced Wekerle Housing Program (government initiative for affordable rental housing and student dormitories) as its specifics are expected by the end of the year. What is certain is that the program, with EUR 550 million of EU money, can play a great role in the development of multi-unit residential construction and can launch big projects – although its impact may be more pronounced in mid-term.

Looking at individual regions, the biggest decline in multi-unit residential construction starts compared to the previous quarter was in Pest County and the Northern Great Plain, where the value of projects entering construction was 80% and 84% less in Q2 than in Q1 this year, respectively. The decrease was also 68% in Budapest and Western Transdanubia. Similar trends are visible compared to the average quarterly Project-Start ​​for Q4 2024-Q1 2026, with the largest drop in Pest County and the Northern Great Plain region, followed by Central Transdanubia and the Southern Great Plain. Budapest registered the fifth biggest decrease (55%).

Despite the decline, Budapest played a key role in multi-unit residential starts this year as well, with at least 70% of such constructions starting here in Q1-Q2 of the year. Based on the average of the past years, the capital city’s share of Project-Start in the past year was 63%, while Northern Great Plain had 8%, Western Transdanubia and Southern Transdanubia had a 7% share each. In the past one year, works started in the lowest value in Northern Hungary: the region’s share was only 2%.

The biggest projects this year are also in Budapest where the construction of the last buildings of Kincsem Residential Park and the first buildings of Láng Quarter started. In case of rural locations, the largest project was Liget Residential Park in Tatabánya, but it did not make it into the top 10 biggest projects. A similar trend was seen in previous years: the largest projects were in Budapest, with only few rural projects making it to the top 10 list that started near Lake Balaton, in Debrecen or Paks.

The value of completed multi-unit buildings spiked to HUF 180 billion in Q2 2026, the highest Project-Completion in the past 11 years at current price but also considered high at constant price. Q2 saw the completion of several phases of Kincsem Residential Park and Phase 1 of Beluga Bay condominium whose construction started in 2023 and 2024. Project-Completion in the multi-unit residential segment may remain high in the second half of this year as well since Epresliget Residential Park in Debrecen and Újbuda Garden condominium in Budapest are expected to be completed.

Will publicly developed housing keep Turkish residential construction resilient?

Written by Prof. Dr. Ali Türel and Prof. Dr. Leyla Alkan Gökler, EECFA Türkiye

In H1 2026 Türkiye saw construction costs go up, which is biting into private housebuilders’ profit margins, while house price growth decelerated in real terms. Permit numbers grew in the first half of the year thanks to the public housing schemes of the government. However, Q2 2026 was already weaker in building permits and construction production, so it remains to be seen whether these public programs will keep residential construction strong.

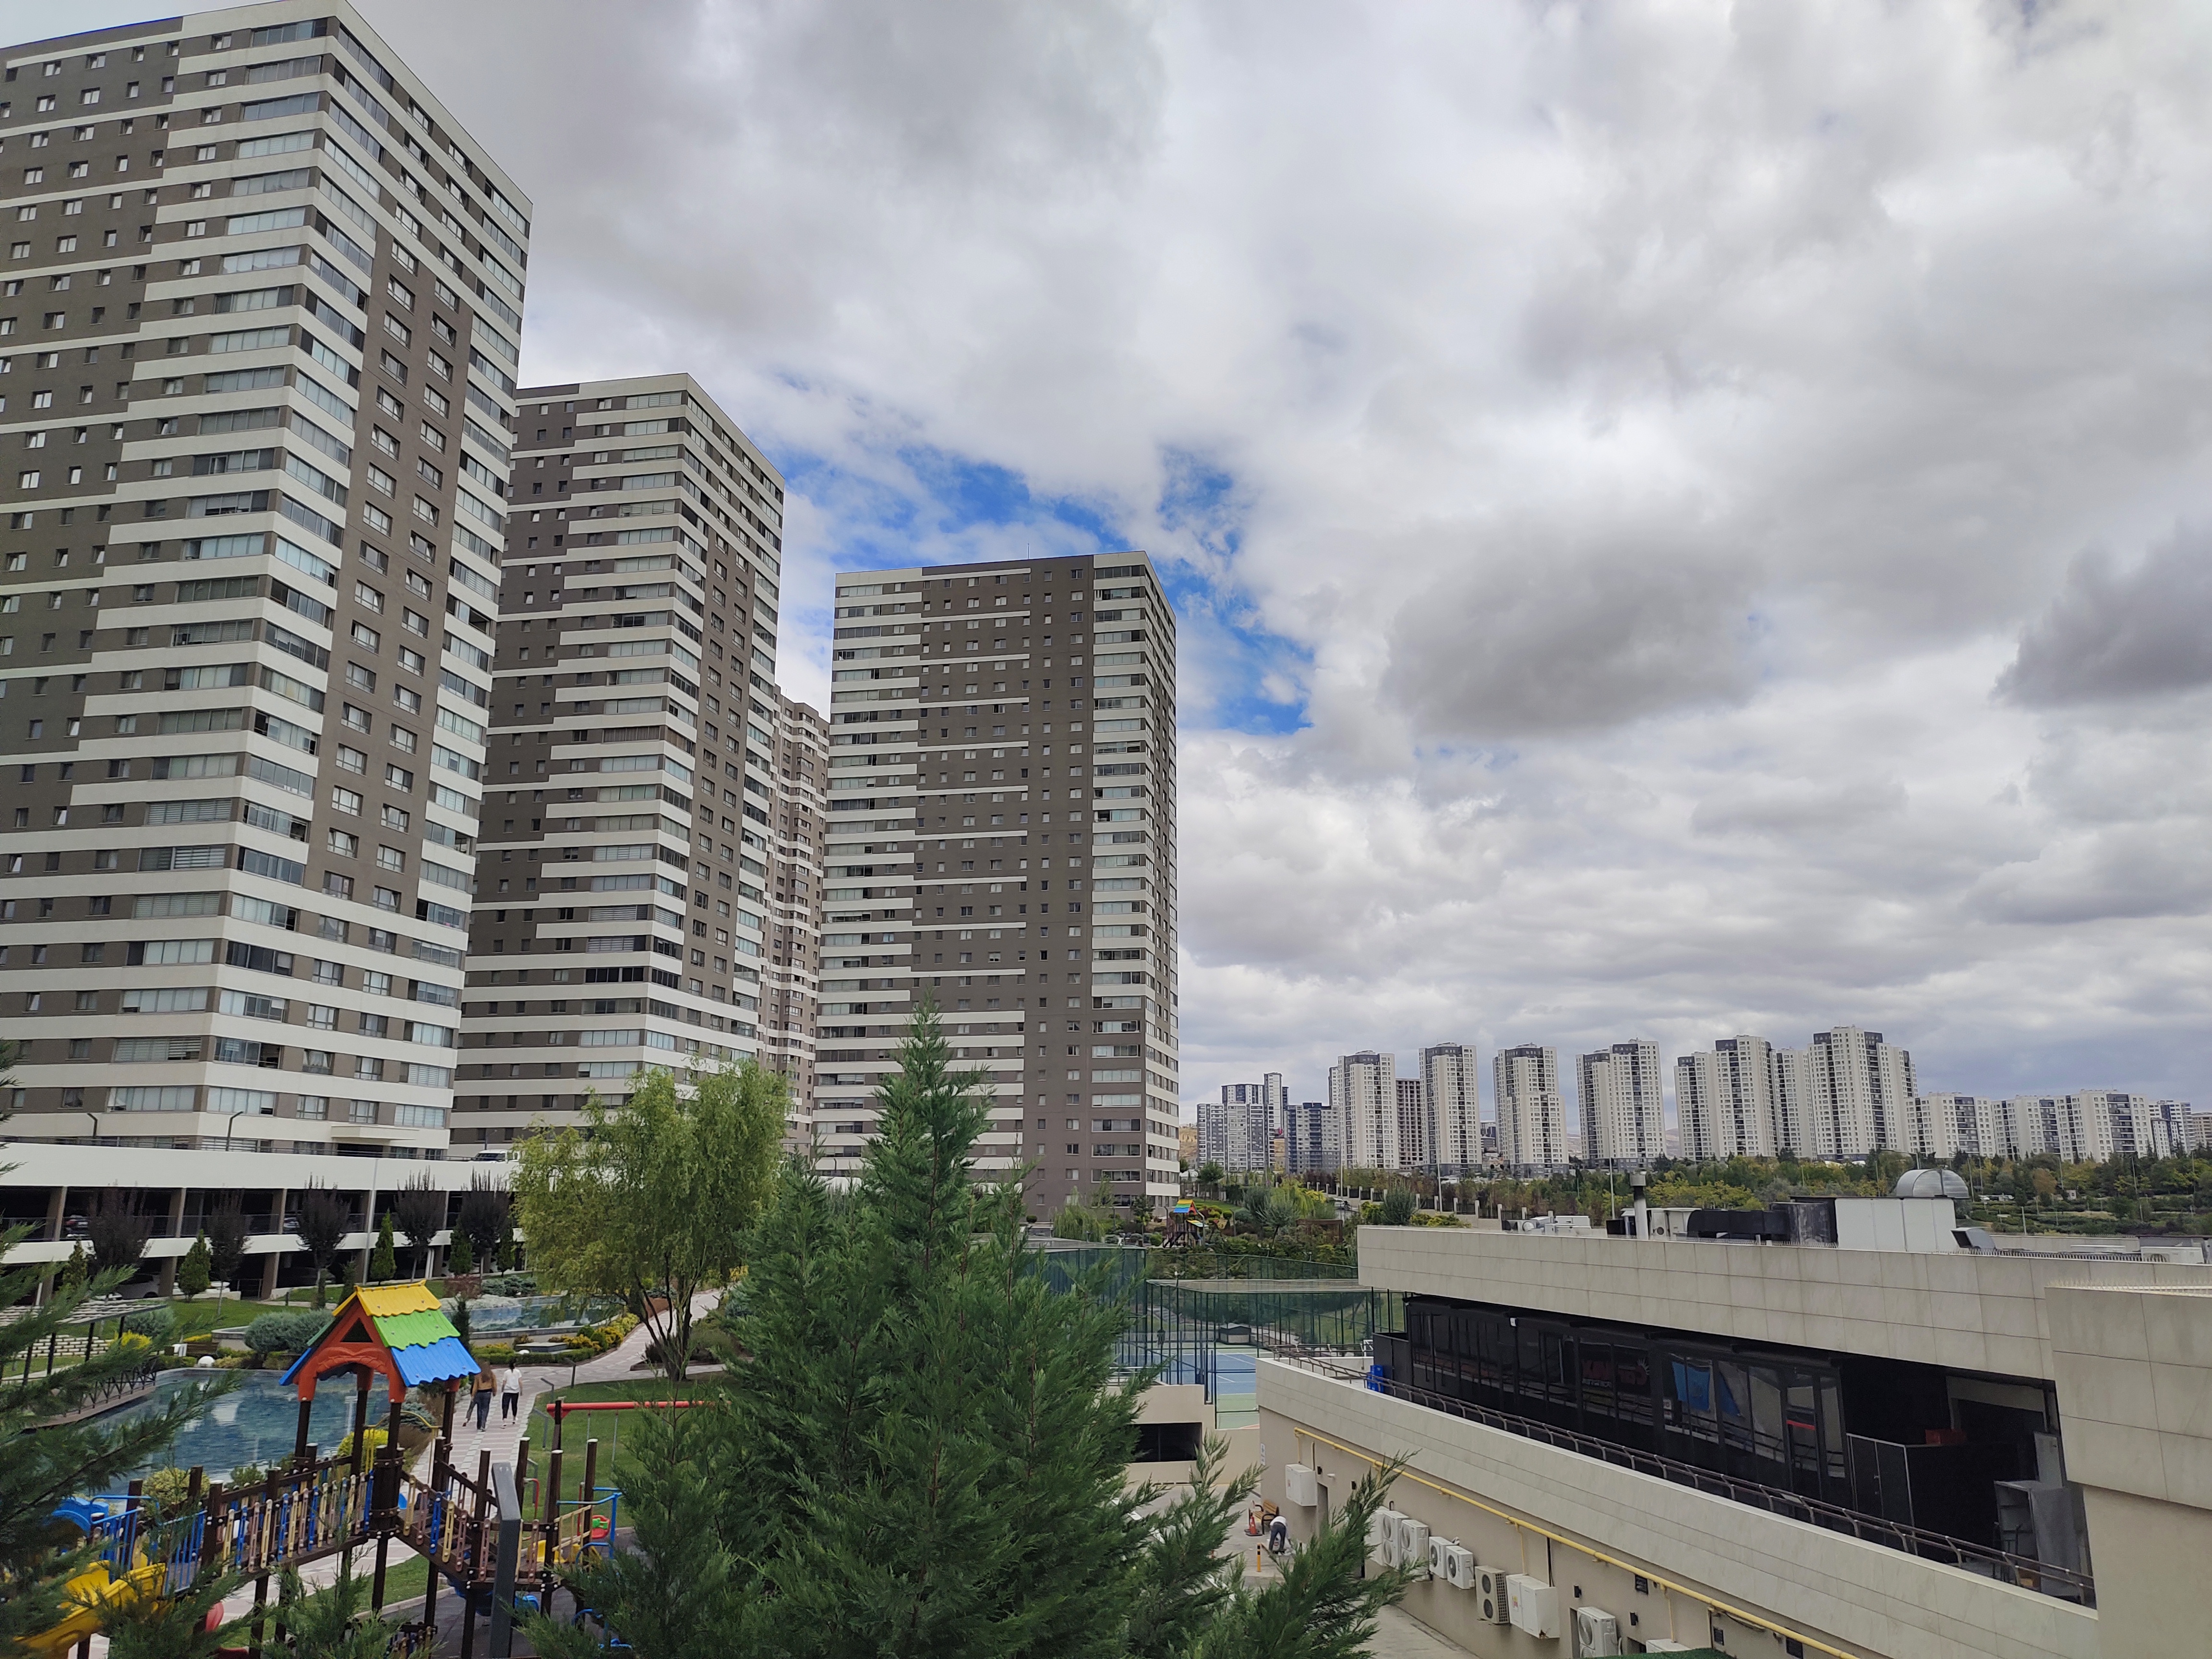
Residential buildings and non-residential development in Ankara – Photo by Prof. Dr. Leyla Alkan Gökler

H1 2026 statistics: construction costs, house prices, building permits

According to the statistics gathered and published by the Turkish Statistical Institute (TurkStat), a comparison of the monthly rates of change in the Consumer Price Index (CPI) and the Construction Cost Index (CCI) for residential buildings shows that construction costs increased at a slower pace than inflation in 2025. In January 2026, however, CCI recorded a considerable increase, while during the remainder of the first half of the year it generally continued to rise at a higher pace than inflation.

A comparison of the monthly rates of change in the Consumer Price Index (CPI) with the House Price Index (HPI) for 2026, published by the Central Bank of Türkiye, indicates that house prices also increased at a slower rate than inflation through June. Looking at the cumulative changes in these three indicators during H1 2026, CPI added 17.76% in June compared to December 2025, while HPI rose by 13.20% and CCI by 20.07%. These figures indicate that house prices grew at a slower pace than inflation during H1 2026, implying a decline in house prices in real terms. In particular, following the sharp increase in the building construction cost index in January 2026 over the rate of increase in house prices, this would inevitably cause a significant decline in profit margins for housing producers.

The number of dwelling units granted building permits reached 513,731 in H1 2026, indicating that construction permits were issued for 35,071 more dwelling units than in H1 2025. In terms of completed dwellings, occupancy permits were issued for 306,687 residential units during H1 2026, representing an increase of 28,990 units compared with the same period of 2025.

New housing developments at the Fringe of Ankara – Photo by Prof. Dr. Ali Türel

Public housing programs

Over the past three years the number of dwelling units granted building permits posted a massive growth, exceeding one million units in 2025, one of the main reasons being the rapid housing reconstruction program undertaken or financed by the government following the major earthquakes of 2023. By the end of 2025, the construction of as many as 455,000 urban and rural housing units, the majority of the post-earthquake housing units to be built, had been completed and delivered to legal beneficiaries.

The Housing Development Administration (HDA, the central government institution) has also been preparing a new social housing program with the intention of providing quake-resistant, low-cost housing with affordable prices, comprising 500,000 housing units since October 2025. Therefore, despite rising construction costs, housing construction continues at a relatively strong pace, with publicly developed housing accounting for a substantial share of building permits. Rise in the building construction cost index at a higher rate can also be related to the effects of the new social housing program of the HDA, and the remaining works of the reconstruction program of earthquake-damaged housing.  

High-rise housing developments in Ankara – Photo by Prof. Dr. Leyla Alkan Gökler

Construction output

Despite the increase in building permits during H1 2026, this momentum has struggled to translate into actual construction output. Calendar-adjusted Construction Production Index declined by 3.1% year-on-year in May and by 6% in June. These falls may be linked to the nearing completion of earthquake reconstructions, as well as the 9.5% fall in housing permits in Q2 2026, although completions have continued to grow since Q2 2025, most likely under the effects of the completed reconstruction of the remaining earthquake-damaged housing. 

With house price increases remaining below the rise in construction costs, the slowdown in construction output suggests that increasing cost pressures and narrowing profit margins are constraining the pace of the private sector’s housebuilding activity. Housing demand is also negatively affected by high interest rates as mortgage credits could be used in only 22% of housing transactions in 2026.

Residential market forecast for Türkiye up to 2028 is available in the EECFA Forecast Report Türkiye. For sample report or orders, contact us.

Traditional residential settlements in Ankara – Photo by Prof. Dr. Leyla Alkan Gökler

EECFA countries in the European Commission’s 2026 Macro Forecast

Written by Tünde Tancsics – ELTINGA, EECFA Research

Similarly to every summer, ELTINGA (EECFA Research) has now examined how the European Commission sees the EECFA countries. Here is the summary of the major changes in economic prospects between the Autumn 2025 and Spring 2026 forecasts.

The economic outlook has deteriorated across almost all countries in the region compared to Autumn 2025, although growth projections remain positive. Serbia, Romania and Slovenia experienced the most significant downward revisions (-0.4 percentage points), while Bulgaria and Croatia underwent only slight adjustments (-0.05 to -0.1 percentage points). Russia was the only country whose projected growth marginally rose. Growth expectations for the EU and the Euro Area also fell moderately, reflecting a general weakening of economic momentum across the region.

In 2026-2027, average GDP growth is forecast to be positive in all countries, albeit to varying degrees. Türkiye is expected to lead the group with a growth of 3.5%, followed closely by Serbia (+3.35%). Meanwhile, Russia and Romania are forecast to have the smallest expansion (+1.2%). Croatia (+2.6%), Bulgaria (+2.35%) and Slovenia (+2.1%) are projected to perform in the middle of the range. The Euroconstruct member Hungary is predicted to grow by 1.95%, which is above the EU average. Despite the general downward revisions, most of the countries in the region are expected to do better than the EU (1.25%) and all of them will likely surpass the Euro Area (1.05%), maintaining the pattern of stronger growth dynamics in East and Southeast Europe.

Since the Autumn 2025 forecast, the projected growth rate of gross fixed capital formation in the region for 2026-2027 has been revised in both directions. The steepest cuts were seen in Bulgaria, in Serbia and in Romania where projected GFCF growth dropped by 0.8-1.75 percentage points. Meanwhile, Hungary, Slovenia, the EU, the Euro Area, and Russia recorded more moderate downward adjustments, while Türkiye and Croatia saw upward revisions. Serbia is still projected to lead in GFCF growth at 5.15%, followed by Türkiye (4.2%) and Romania (3.2%). Bulgaria (1.25%) and Russia (0.35%) remain at the lower end of the spectrum. The EU (2.1%) and the Euro Area (1.75%) continue to lag behind most countries in the region.

Growth expectations for gross fixed capital formation in construction have been modified across countries where data is available, in both positive and negative directions. The most notable upward revisions occurred in Slovenia where projected construction investment growth increased by 1.55 percentage points to 4.9% (the highest in the group). Romania ranked second in terms of expected growth with 4.85%. Compared to Autumn 2025, Croatia saw a more significant upward revision in its projected growth rate (1 percentage point); the third largest increase in gross fixed capital formation in construction is expected there (3.05%). By contrast, Hungary and Bulgaria experienced the biggest downward revisions, falling to 2.95% and 1.6%, respectively. In the broader European context, construction investment is projected to rise only modestly to 1.85% in the EU and 1.6% in the Euro Area, remaining below most national forecasts in the region.

The Commission’s view on expected construction investment is quite different from ours. Partly it is because we examine the sector from the bottom. For each segment we come up with an individual story and this is how the total construction market is formed. Our latest forecast is in the 2026 Summer EECFA Construction Forecast Reports. Sample report and order

We, at EECFA, are a little less optimistic in East Europe and a little less pessimistic in Southeast Europe than half a year ago. On country level, we expect 4 countries to be in the red until 2027, while truly sizeable growth is foreseen only in Türkiye and Ukraine. The latter is explained by the small base, though.