


In Q2 2016 the number of permits issued in the latest 4 quarters for residential homes increased by 14% in the Balkan EECFA countries together, compared to the same period last year. Turkey registered a 10% growth in this term, while Ukraine’s Q1 2016 (latest available) figures are almost 30% up.
In case of non-residential buildings, permitted floor area remained at the same level in the Balkan as recorded a year ago, while Turkey saw a drop of 1% in Q2 2016, and Ukraine ended up 20% positive in Q4 2015 (latest available).
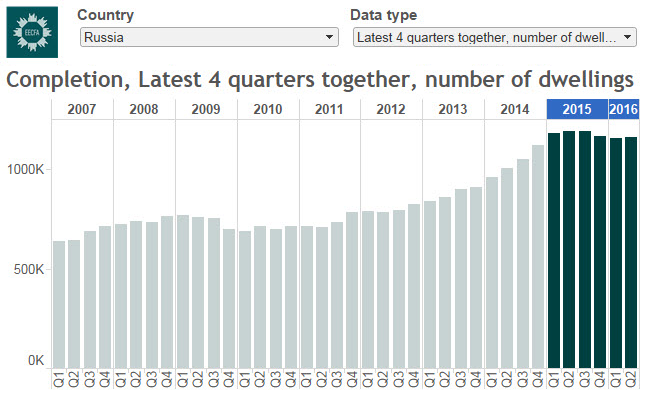
In Russia, residential completion of the latest 4 quarters decreased by 2% in Q2 2016 and non-residential completion stood at 1% in comparison with a year ago. (Russia-wide permit data is not available)
The updated interactive permit-completion graphs of EECFA countries are available here:
- Residential permit-completion (number of dwellings)
- Non-residential permit-completion (floor area and number of buildings)
On the residential graphs, the number of dwellings is displayed, and you can choose the countries and the data type. Besides these options, on non-residential graphs you can also choose the indicator type (floor area or number of buildings)
As we regularly issue forecasts, for us the most important question of this compilation is whether the newly incoming data are in line with our latest (short-term) forecast or not. So below we have highlighted some countries and tried to put the figures into this perspective.
- Residential permit– Biggest growth rates: Serbia
Almost 13 thousand permitted dwellings in the Q2 2015 – Q2 2016 period translate to a 44% growth on comparable basis. This is supporting our view that completion could start increasing this year.
- Residential permit– Biggest growth rates: Ukraine
Permit reached an estimated 178 thousand in the last 4 reported quarters together, which is a 29% increase, while completion was above 110 thousand. It does not contradict our view that completion in 2016 will remain at around its 2015 level.
- Residential completion – Biggest markets: Russia
In the Q2 2015 – Q2 2016 period 1 170 thousand dwellings were completed, a 2% drop on comparable basis. Data so far are in line with our expectations.
- Residential permit – Biggest markets: Turkey
Almost 960 thousand dwellings were permitted in the last 4 quarters including Q2 2016, meaning a 10% increase compared to a year ago. Completion stood at around 725 thousand, 3% more than in Q2 2015. These are in line with our predictions.
- Non-residential permit – Biggest growth rates: Serbia
In Q2 2015 – Q2 2016, surpassing well its 2007-2008 level, 1.5 million m2 non-residential floor area was permitted, meaning an almost 100% jump from a year ago. This is supporting our optimistic outlook.
- Non-residential permit – Biggest growth rates: Slovenia
Slovenia is coming back from very low levels, in the Q2 2015 – Q2 2016 period altogether 735 thousand m2 non-residential floor area got permit, an increase of almost 60% over a year earlier. This is also in line with our positive outlook.
- Non-residential permit – Biggest markets: Turkey
Permits for around 48 million m2 of non-residential floor area were issued in the latest 4 quarters until Q2 2016, which is virtually the same level than a year ago. This does not contradict with our soft-landing scenario. Completion is 11% in the positive territory in the Q2 2015 – Q2 2016 period against the corresponding period a year ago, but in case of non-residential sub-sector, the connection between output and completion is not as strong as in case of residential.
- Non-residential completion – Biggest markets: Russia
Coming down very slightly from the peak, in Q2 2015 – Q2 2016 around 30 million m2 non-residential floor areas were competed. Investment into non-residential construction has been shrinking recently, so this does not contradict our pessimistic outlook.
The interactive graphs are updated half-yearly, in between 2 report issuance. If you would like to have the row data in xls, feel free to contact us.
Data are from national statistical offices: NSI, Crostat, KSH, Insse, Rosstat, SURS, SORS, Tuik, Ukrstat