A második negyedévben visszaesett a Projekt-Kezdés a társasházi lakásépítési részpiacon. A nagyon jó első negyedév miatt azonban az elmúlt félév összességében erősnek mondható. A nem-lakás magasépítési részpiac viszont rettentően gyenge, továbbra is rekord alacsony a megkezdett munkák összértéke. A mélyépítés jobban néz ki, mint tavaly ilyenkor, de ez leginkább a szuper-alacsony bázis miatt van. Az év eddigi részében nem indult igazán nagy közlekedési projekt.
Átneveztük a mutatószámainkat a könnyebb érthetőség kedvéért; mostantól Projekt-Kezdés/Befejezés néven utalunk a megkezdett/befejezett kivitelezési munkák összértékére. A vizualizációban is a korábbi Aktivitás-Kezdés/Befejezés helyett a Projekt-Kezdés/Befejezés kifejezésekre térünk át.

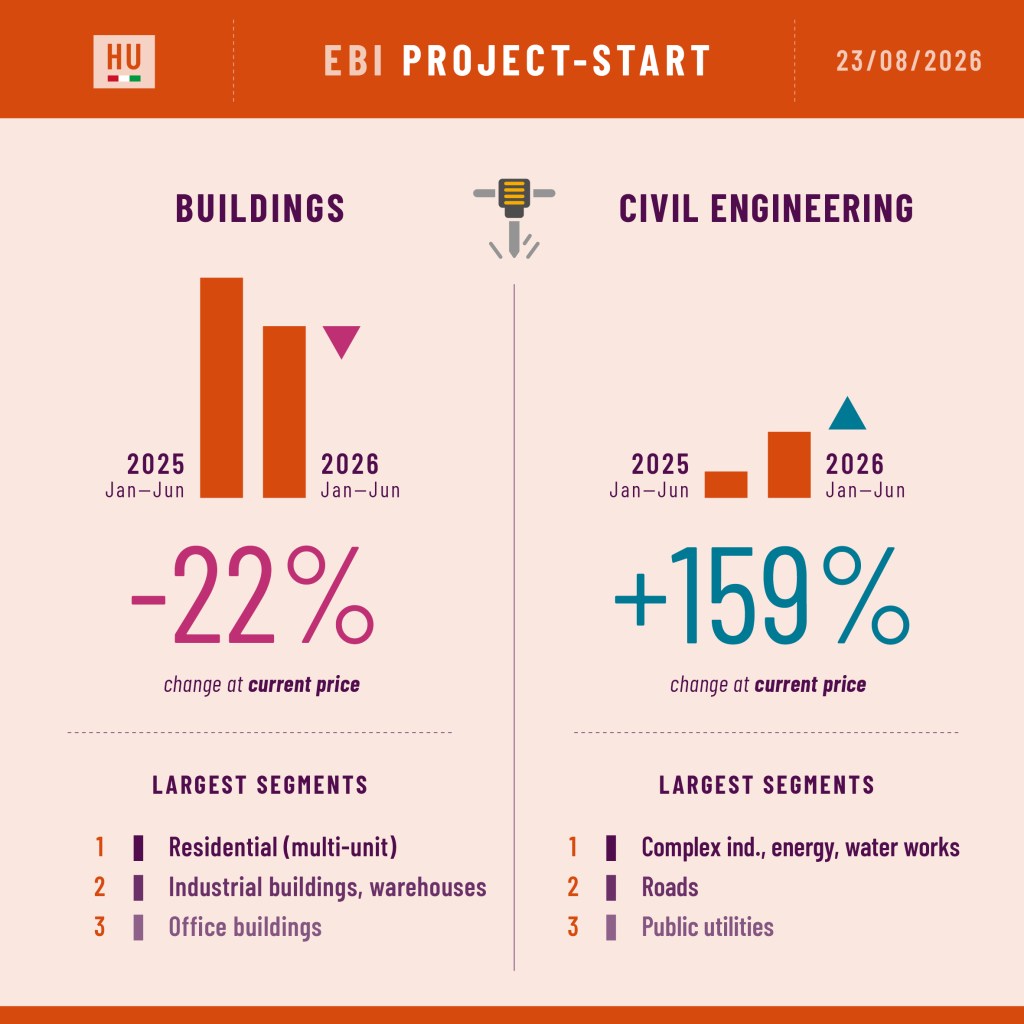
A poszter a két nagy építési részpiac Projekt-Kezdés indikátorának időszak/időszak változását mutatja, valamint a szegmenseket amelyekben a legnagyobb értékben indultak kivitelezések. Ezt a posztert minden hónapban kitesszük ide a blogunkra. A teljes építési piacot részletesen bemutató EBI Építésaktivitási Adatvizualizációt (összesen 18 szegmens adataival) is havonta frissítjük, és negyedévente az EBI Építésaktivitási Jelentésben is elmondjuk, hogy mit látunk a piacon. Ha érdeklik a részletek akkor a contact oldalon írjon nekünk.
Project-Start in the multi-unit housing construction submarket declined in Q2. However, due to the very good first quarter, the past half-year as a whole can be considered strong. The non-residential construction submarket, on the other hand, is terribly weak, the total value of started works is still at record low. Civil engineering looks better than this time last year, but this is mostly due to the super-low base. No big transport-related project has commenced so far this year.
We have renamed our indicators for the sake of easier understanding; from now on we refer to the total value of started/completed construction works as Project-Start/Completion. In the visualization, we are also switching to the terms of Project-Start/Completion instead of the previous Activity-Start/Completion.
The poster (above) shows the period/period changes of the Project-Start indicator in the 2 main submarkets and the segments with the largest value of started works. This poster is published every month here in the blog. The EBI Construction Activity Data visualization with the details on the whole construction market (with altogether 18 segments) is also updated monthly and the EBI Construction Activity Report, summarizing what’s happening in the market, is published in each quarter. If your interest in construction markets is deeper, please contact us for the details.
Dear Janos Gaspar! Can the spectacular summary image be published on another website, and if so, under what conditions?
I have the same question, for other visualizations (charts, dataset statements)
Thank you for your answer.